A recent bank run has sent bank shares down. However, the Q1 reports of the largest US and European banks have been quite positive. In this brief analysis, we will take a closer look at what has happened to banks in Q1 2023.
Fundamental background
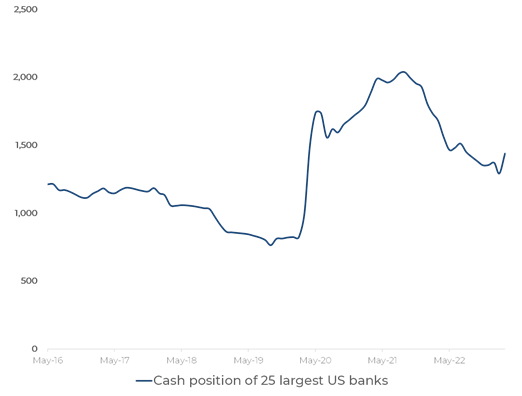
The bank run in Q1 was only typical of small and medium-sized banks. The US banking system as a whole is awash with extra liquidity provided by the Fed as an anti-pandemic measure. Figure 1 demonstrates the cash position of 25 largest US banks.
The uptick in March was caused by rescuing smaller banks, but we believe it is temporary. The Fed's objective is to reduce the cash position of the banking sector to mitigate inflation risk. Selling out its assets is a tool that the Fed applies for that purpose.
However, banks are still holding huge amounts of extra money that they cannot invest. The credit demand at the 5% key rate is limited. For this reason, the liquidity pillar of US banks is much more solid than before COVID. Even if clients withdraw their money from banks and put it into money-market funds or other similar instruments, the liquidity returns to the banking system through a chain of intermediaries.
Figure 1
Large banks follow this logic: they cannot evade the main trend of the industry because of their scale. Smaller banks, on the other hand, are much more flexible. Their ability to invest more aggressively turned out to be a drawback when depositors turned risk-averse.
During the bank run, investors forgot about the main drivers for the banks' balance sheets:
• Rising rates allow banks to earn more interest income.
• Volatile markets lead to enhanced market-making profits.
M&A activity is currently at its bottom, but this is not new and does not affect expectations. Table 1 shows the Q1 reports of the largest banks. All four banks except for Goldman Sachs have exceeded expectations in revenues and profits. Goldman Sachs surprisingly fell off the common logic.
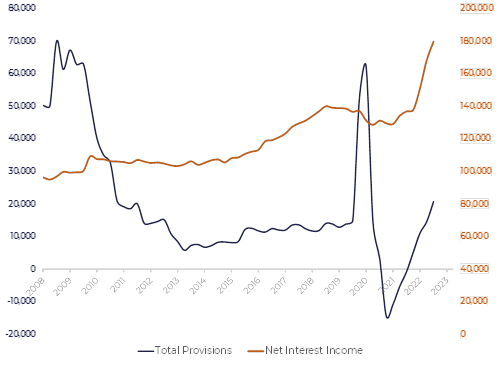
Provisions have also risen, indicating that the economy is beginning to suffer from the high-rate environment.
|
Bank |
Wels Fargo |
Citi |
Goldman Sachs |
BofA |
|
Revenue |
20.7bn (+0.70) |
21.4bn (+1.5) |
12.2bn (-0.6) |
26.3bn (+1.1) |
|
EPS |
1.23 (+0.10) |
1.86 (+.21) |
8.79 (+0.58) |
0.94 (+0.12) |
|
Net Interest Income |
13.3bn (+0.20) |
13.3bn (+0.70) |
1.8bn (-0.40) |
8.6bn (+0.2) |
|
Loan Loss Provision |
1.2bn (+0.30) |
2.0bn (+0.15) |
-0.2bn (-1.0) |
1.1bn (+0.15) |
|
Trading Revenue |
— |
5.6 bn (+0.25) |
8.4bn (-0.34) |
5.0bn (+0.6) |
|
Return on Assets, % |
|
|
|
1.07 (+0.15) |
Table 1. Q1 2023 US banks reporting*
*numbers in () reflect the deviation from the medium expectations
Strong reporting is supporting banks’ stocks amplifying the recovery momentum that started after the bank panic was over (Figure 2).
The most intriguing thing about the current reporting is that two opposite factors are most noticeable: rising interest income and rising provisions. So far interest income has dominated, however, its potential to grow further seems limited since we have come close to the maximum of the key rate. Provisions, by contrast, are just starting to grow.
BofA CEO Brian Moynihan predicted during an investor call “a shallow recession” beginning in the third quarter. JPM followed suit.
It is probable that the market momentum will push the bank stocks higher, but the nearest technical resistance levels that are 5—10% above the current levels depending on the name might become a serious obstacle.
Figure 2. Largest US banks stock prices
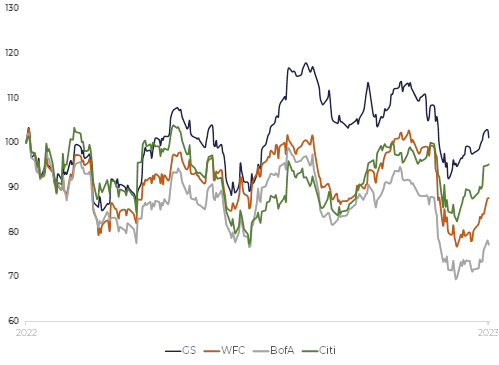
Figure 3. US banking sector aggregate figures