Unlike stocks or currencies, Bitcoin can hardly be described fundamentally. However, cryptocurrencies have something that makes them interesting target for investments. In this review we are focused on Bitcoin. First, it is the first successful crypto project. Second, all cryptocurrencies correlate. Understanding Bitcoin means understanding half of the crypto world.
Bitcoin infrastructure has two principal differences with classic currencies:
- New accounting and record keeping technology – Blockchain,
- Monetary principle – this is the set of rules determining how many new Bitcoins is to be printed
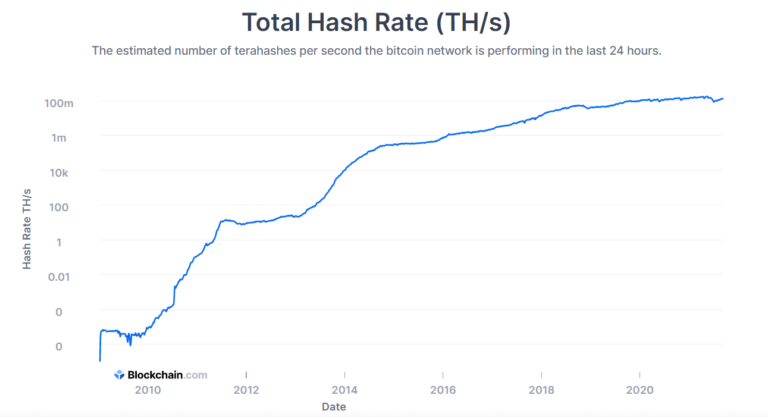
The key feature of Blockchain technology is the absence of a central point of keeping the database with Bitcoin transactions. This information is spread across the universe of Bitcoin miners, just like with torrent files. Miners install special software that keeps all transaction records. Running this software rewards miners with the cryptocurrency[1]. Keeping all transactions around the world requires much of processing. Processing power of computers can be described through so called “Hash Rate”. One hash is a simplest computer action. The more powerful a computer is and the more time the software is running the more Bitcoins is to be printed. Thus, miners are motivated to keep their computers running all the time. Doing so, they support the global Bitcoin infrastructure.
Each day more than 300’000 transactions with Bitcoin are concluded. Therefore, the record keeping becomes “heavier” with every day: Bitcoin mining cost is increasing.
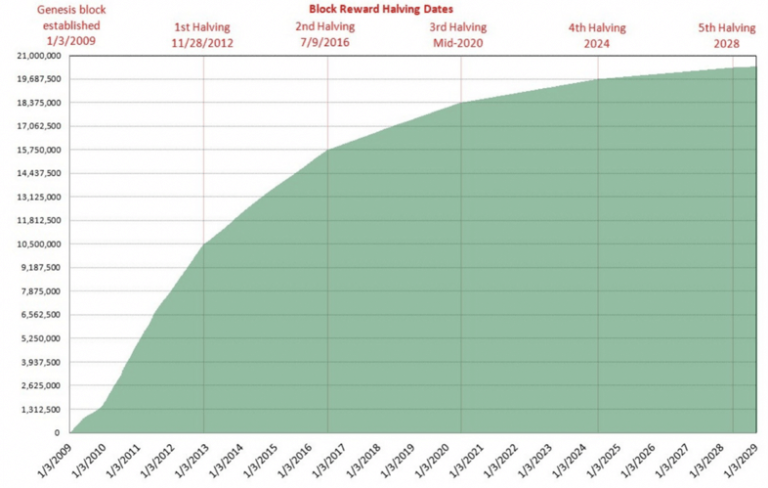
On the other hand, Bitcoin emission is limited. The maximum number of Bitcoins that can theoretically exist is 21 million.
The rate of XBT emission halves every four years as it is shown on Figure 1. The scarcity of Bitcoin pushes its price up. Cost price is going up too, tying up the monetary emission algorithm and the Blockchain record keeping technology in one. Price growth involves loads of speculators from all countries into the mining game.
This leads us to a question – where is the end of this game? What will happen after all 21 million Bitcoins have been printed? How does it affect the current pricing?
Many take Bitcoin as the image of the future of the world of currencies. Many treat it as a hollow bubble.
We would draw a line between the Blockchain technology and the emission principles of Bitcoin.
Blockchain, no doubt, has a bright future. Information diffused among millions of computers across the globe seems to be more protected than one stored on a central server, even considering a secondary server located at another place.
Monetary principles is different. Bitcoin emission rules are simple: circa 893 Bitcoin are issued each day. This number halves every four years so that by 2040 21 million Bitcoins will be issued. After that the emission stops. 21 million remains the total number of bitcoins forever.
When it comes to classic currencies, countries regulate emissions through banking systems with the centrals banks on top. After the gold standard became history, the importance of monetary policy has only been increasing. It is the central banks that fight 2008 Financial crisis or 2020 Coronavirus crisis. Each month global investors follow the words of Head of the FRS, trying to read between lines something pointing at what he really thinks. Upon central banks’ decisions inflation and deflation depend.
After 2040 miners will no longer be rewarded for mining. If we assume that Bitcoin will be circulating and eligible for making transactions, then the record keeping will require more and more processing. Without motivation to mine, the risk occurs that Bitcoin price will eventually fall under the cost of record keeping. That might lead to operating issues and losses of data: the number of miners will sharply decrease.
Anyway, the fluctuations of all crypto currencies are inconsistent with the sheer idea of currency. Volatile currency destroys the economy. Therefore, central banks will possibly adopt Blockchain elements of record keeping, albeit with the total control over the monetary policies.
So far, more progressive central banks allow limited circulation of crypto currencies. Their intention is to investigate how to deal with the crypto world in practice.
Other central banks pull crypto out of legal regulation, fearing destabilizing local monetary systems.
For our part, we will take a deeper look at figures, correlations and various patterns existing in the crypto world right now.
Bitcoin price behavior interpolation
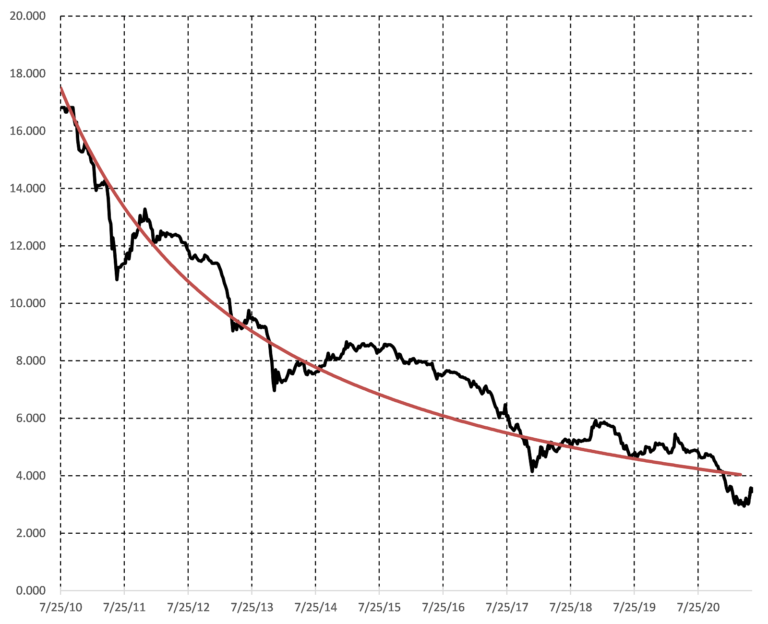
The black line on Figure 2 represents the logarithm of the bitcoin price as follows:
x=14 – ln(Bitcoin Price).
The red line is a trend approximation of the black one:
x=0.7/(T⁄80+1⁄25),
Where T is the number of years on the Bitcoin initiation in 2010.
These equations are not made up following fundamental logic. It is just an approximation which has been working out so far. Red line can be taken as a neutral “fair” level for Bitcoin.
Just for the reference, on 9th Sep 2021 the Bitcoin fair value was $24.18/XBT.
The black line is quite volatile. The typical upswing corresponds to the fall of Bitcoin to approximately half of its fair value. By contrast, when an uptrend hauls Bitcoin above its trend, the highest point is near twice as much as its neutral valuation.
That means that the fair corridor for Bitcoin is now $12—50/XBT.
The reasonable investing approach would be buying an asset closer to the bottom of the range. At circa $50 we consider XBT as overvalued.
We can go further and estimate the future return of Bitcoin. If the model worked for another ten years and the Bitcoin price was around the red line, the rate of return of Bitcoin from 8th Sep 2021 to 9th Sep 2031 would be 10% per annum sharp.
This is not very far from what perspective stocks or high yield bonds can offer. We should bear in mind, however, that investing in Bitcoin cannot be fundamentally justified. This is the main distinguishing feature from even high-risk bonds.
Buying XBT at its trendline level ($24k) shifts the yield to 16%. If we are lucky enough to catch Bitcoin at $16k we can get 21% of annual return for the next 10 years. Not bad in case Bitcoin manages to survive until that time.
Of course, this model should be taken carefully. It cannot be logically explained why this approximation works. However, it is not worse or better than any trend line drawn on any price chart.
A bit of fundamental factors
As of 8th Sep 2021, the total Market Capitalization of the Bitcoin market was $780bn. This is 3.5% of US GDP. According to our model, by 2031 the Bitcoin price can reach $240’000 which would lead us to $4tn of its total capitalization. This is a quarter of current US GDP and 4% of the global one.
No doubt, crypto currencies are becoming quite noticeable part of the global financial system. Due to its scale, the crypto market will require regulation and transformation.
Bitcoin has even become a significant player in electricity market. All mining computer stations consume 6GW of electricity. This power would be enough for a big city with several-million population. It is roughly 8% of the total electricity capacity of Enel – one of the largest electricity producers.
Let us go micro now.
In 2020 40TH/s mining station’s price was around $2’800. Such a station looks like a typical computer and consumes 1.5kW of electricity. Being mining all day it can produce (given the current Bitcoin emission rate and the total number of miners) 0.000225XBT a day, which gives at current market $5.96 a day. Total cost of 36kWh spent during the whole day is $4.32 at $0.12 per kW.
Thus, the gross profit is $1.64 a day or roughly $600 a year. Which is not bad albeit not brilliant given fast depreciation of the mining station.
It should be mentioned that the rate of the Bitcoin emission does not depend on the total number of mining stations. That means that if, for some reason, the number of miners falls 10 times each miner gets 10 times more bitcoins than before.
From the financial market analysis perspective this means that the term “mining cost” does not actually exist in the Bitcoin market. The cost of mining can be almost zero, theoretically. Even if only one miner with 40TH/s station remains in the world, he will get all 893 of Bitcoins being issued daily. That gives us, given the electricity cost, half of a cent for a Bitcoin.
This is a striking difference with another “global bubble” – gold. It is known that the gold producers are forced to spend $700-800 to mine and produce the ounce of gold. This sets a breakeven point for gold, supporting its price at a higher level (this is not the only difference, of course: people like the way the gold looks, it can also be used for industrial purposes).
In case of Bitcoin the cost price is proportional to the quantity of miners. The more miners – the higher mining cost – the more miners are involved attracted by the price growth. This is a nature of a financial bubble.
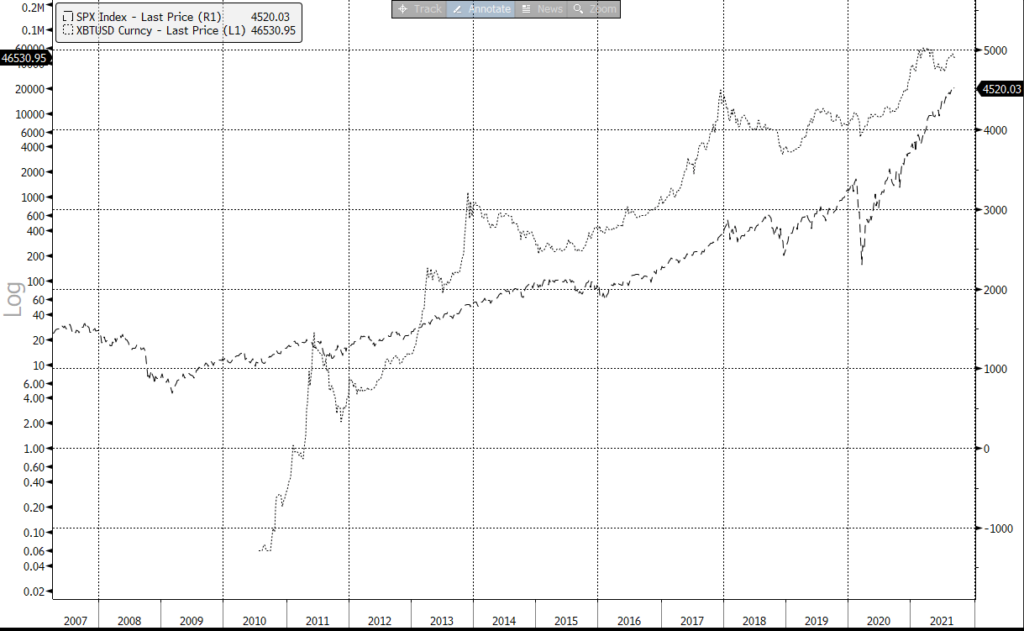
This does not reduce the importance of Bitcoin market, however. Every market, every stock has some features of bubble – this is a nature of financial markets. Moreover, one can see a correlation between S&P 500 and Bitcoin. The latest surge of Bitcoin in 2020 corresponded to a stock market jump up.
Figure 4 displays this correlation explicitly.
Financial markets are now heavily affected by non-professional individuals. Perhaps, this is the major factor explaining the surge of stocks in 2020, after the coronavirus shock. The behavioral patterns of individuals in all markets are the same. Therefore, patterns of Bitcoin price chart might say a lot about the stock market.
There have been three major falls of Bitcoin: in 2011, in 2014 and in 2015. All three times it was a harbinger of the weakness of American stocks.
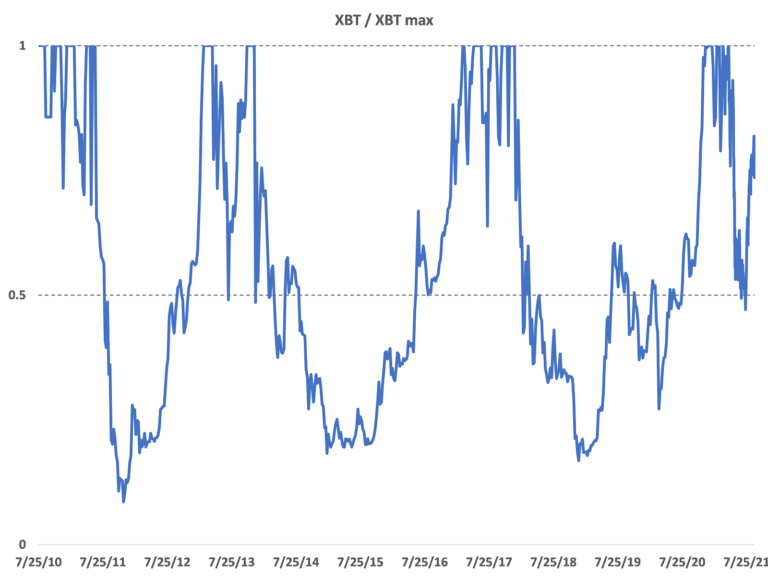
Figure 5 helps us make one more observation. It shows how less the current XBT quote than its previous top. If (XBT/max(XBT)) is equal to 1, then XBT is at its highest point. Value of, say, 0.75 tells that XBT is 25% below its recent historical top. So, each time Bitcoin fell 50% it continued falling after that. In July 2021 Bitcoin fell slightly more than 50% from its top.
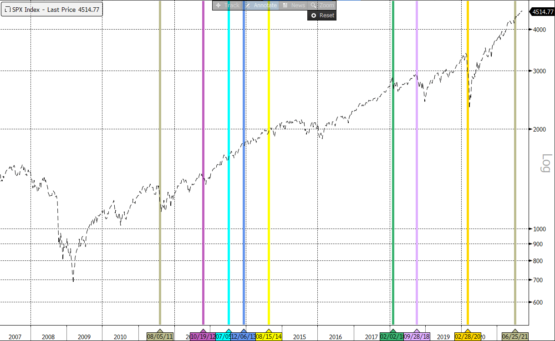
At last, Figure 6 shows all 50% Bitcoin corrections on S&P 500 chart.
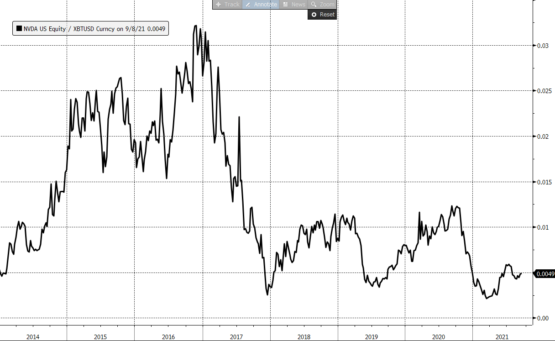
Besides, Bitcoin directly affects the Graphic processor market. Top producer of the fastest GPU – Nvidia – has been one of the best performing stocks over the past seven years. Figure 7 shows NVIDIA stocks priced in Bitcoins. It is amazing, NVIDIA bitcoin price has not changed since 2014. This leads to a question for those who invest in Bitcoin – are NVIDIA stocks a good alternative to Bitcoin? Having the same growth rate, investment in NVIDIA is far more fundamentally justified. Even in case the Bitcoin bubble bursts NVIDIA will continue to produce its processors. The processor market has long-term great growth prospects with the Artificial Intelligence sector being the driver.
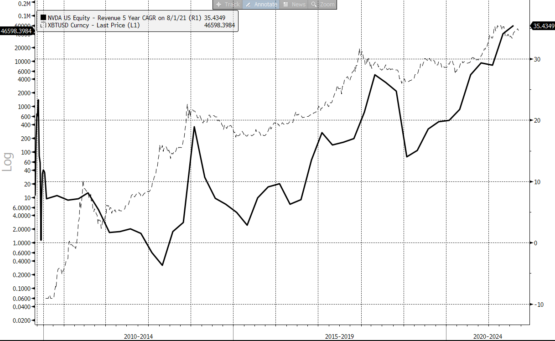
Figure 8 points to how Bitcoin dynamics affects NVIDIA sales growth. The influence of the crypto market is not direct, though: according to the company’s reporting, the share of crypto mining-related revenue is around 4% with gaming and data centers being the major drivers.
For practical portfolio management needs it should be kept in mind that serios bitcoin correction periods were ones of depression of NVIDIA stocks.
Summary
Bitcoin is a purely speculative market without the intrinsic fundamental value. However, its behavior has common feature with one of stock market. Moreover, its technological platform – Blockchain – has bright prospects for other, more regulated crypto currencies in future.
According to out interpolation model, Bitcoin is overvalued. It might be an interesting investment below $20k.
In July 2021 XBT went below 50% of its April high of $64.9k. Such corrections historically resulted in further decline of Bitcoin.
50% Bitcoin correction might also be a sign of the weakness in the stock market.
The crypto market trends must be considered when investing in graphic cards producers.
[1] Various mining software can be found, for example, through this link: https://www.softwaretestinghelp.com/bitcoin-mining-software/