The dramatic fall of US debt prices leads to multiple questions about the nature of ongoing processes in the US economy. As often happens at moments of surging market fluctuations investors are seeking an explanation far beyond where logic resides. We are highlighting several aspects of the current US government debt market.
The volume of US Treasury bonds issuance
In real terms the issuance of new bonds stands at the same level as it was before the pandemic:
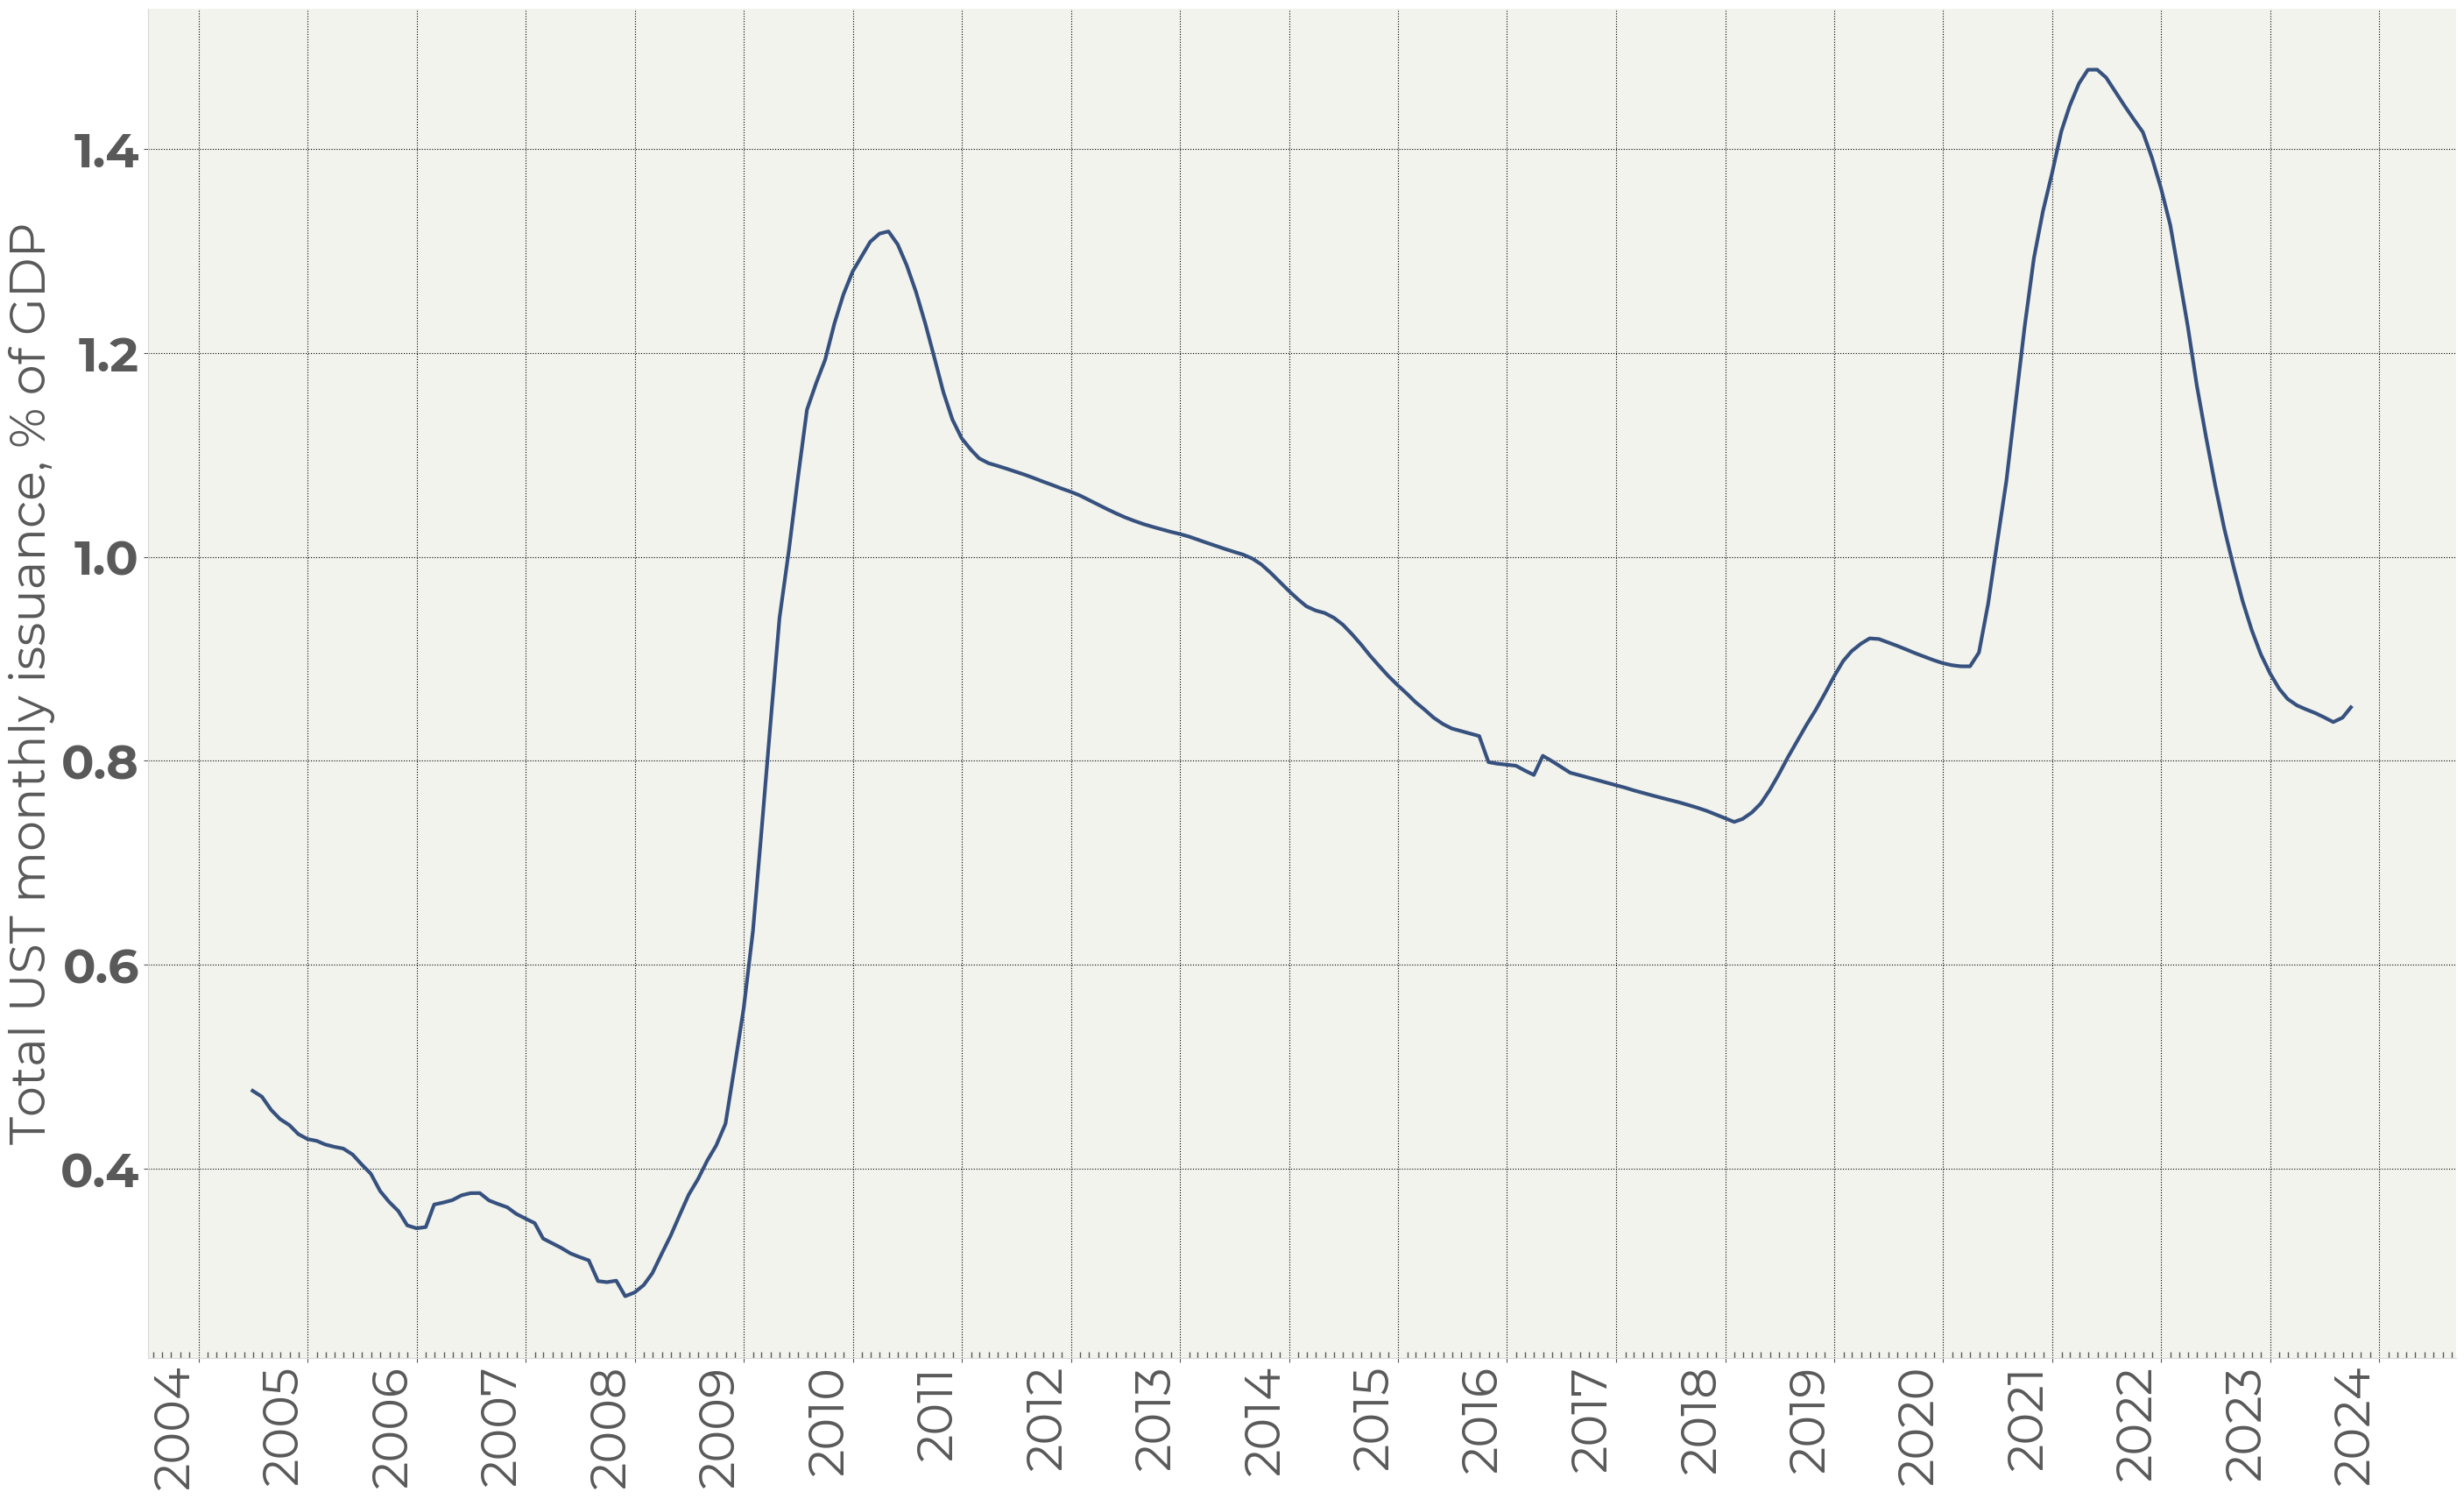
Figure 1. Total US Treasury bonds issuance, % of GDP
Figure 1 does not reflect the sale of bonds by the Federal Reserve. Monthly Fed offering stands at nearly $90bn or 0.3% of GDP which sends the total offering close to its historical high.
Figure 2 represents the Fed’s bond position broken up by maturity:
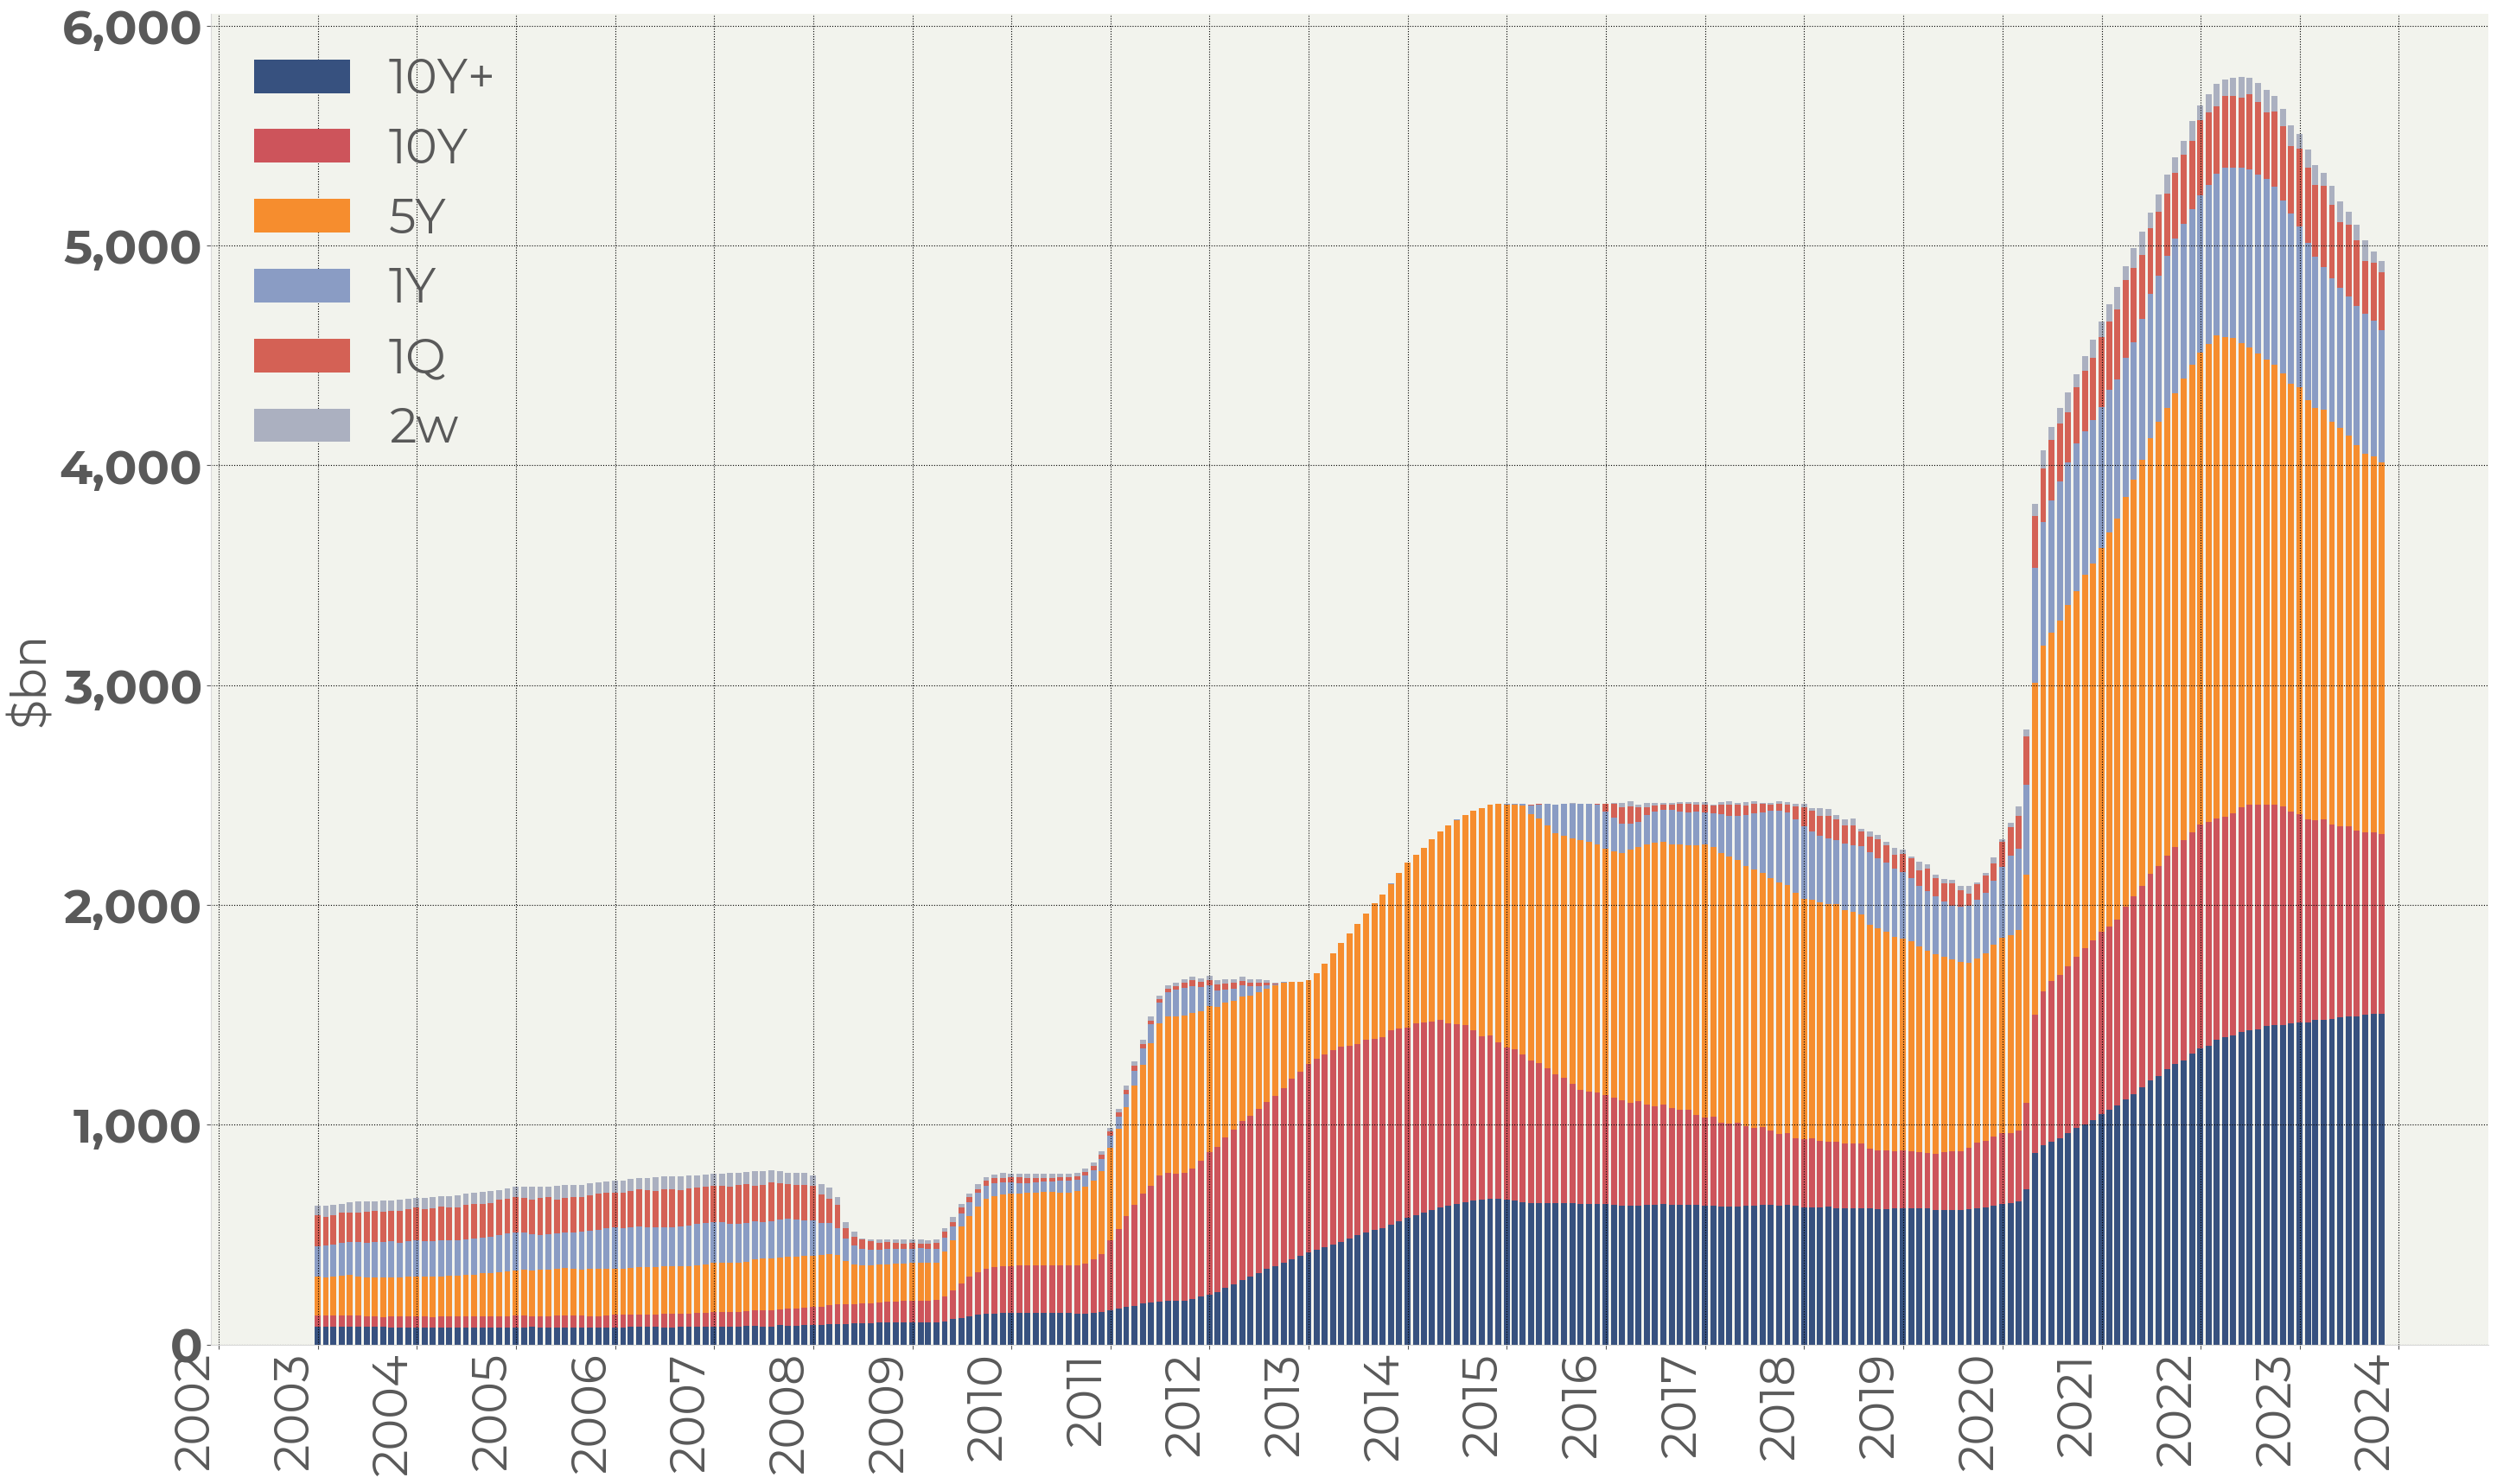
Figure 2. The Federal Reserve US government bond position
Figures 1 and 2, brought together, demonstrate that the post-pandemic bond issuance was totally absorbed by the Fed, so the surge in the government borrowing did not affect the yield curve significantly. The Federal Reserve’s strategy changed at the end of 2021. That was the starting point of one of the most prominent yield rises over the past fifty years.
The Federal Reserve influence
No doubt, the supply of bonds from the Fed is a crucial factor, and many point to the fact that it seriously changed the supply-demand balance in the bond market.
However, it is worth noting that the Fed’s supply is caused by the excess of cash in the US banking system. This money is a result of a massive bonds purchase by the Fed. Banks were large sellers of bonds three years ago, and a huge liquidity pile is held on their accounts with Fed:
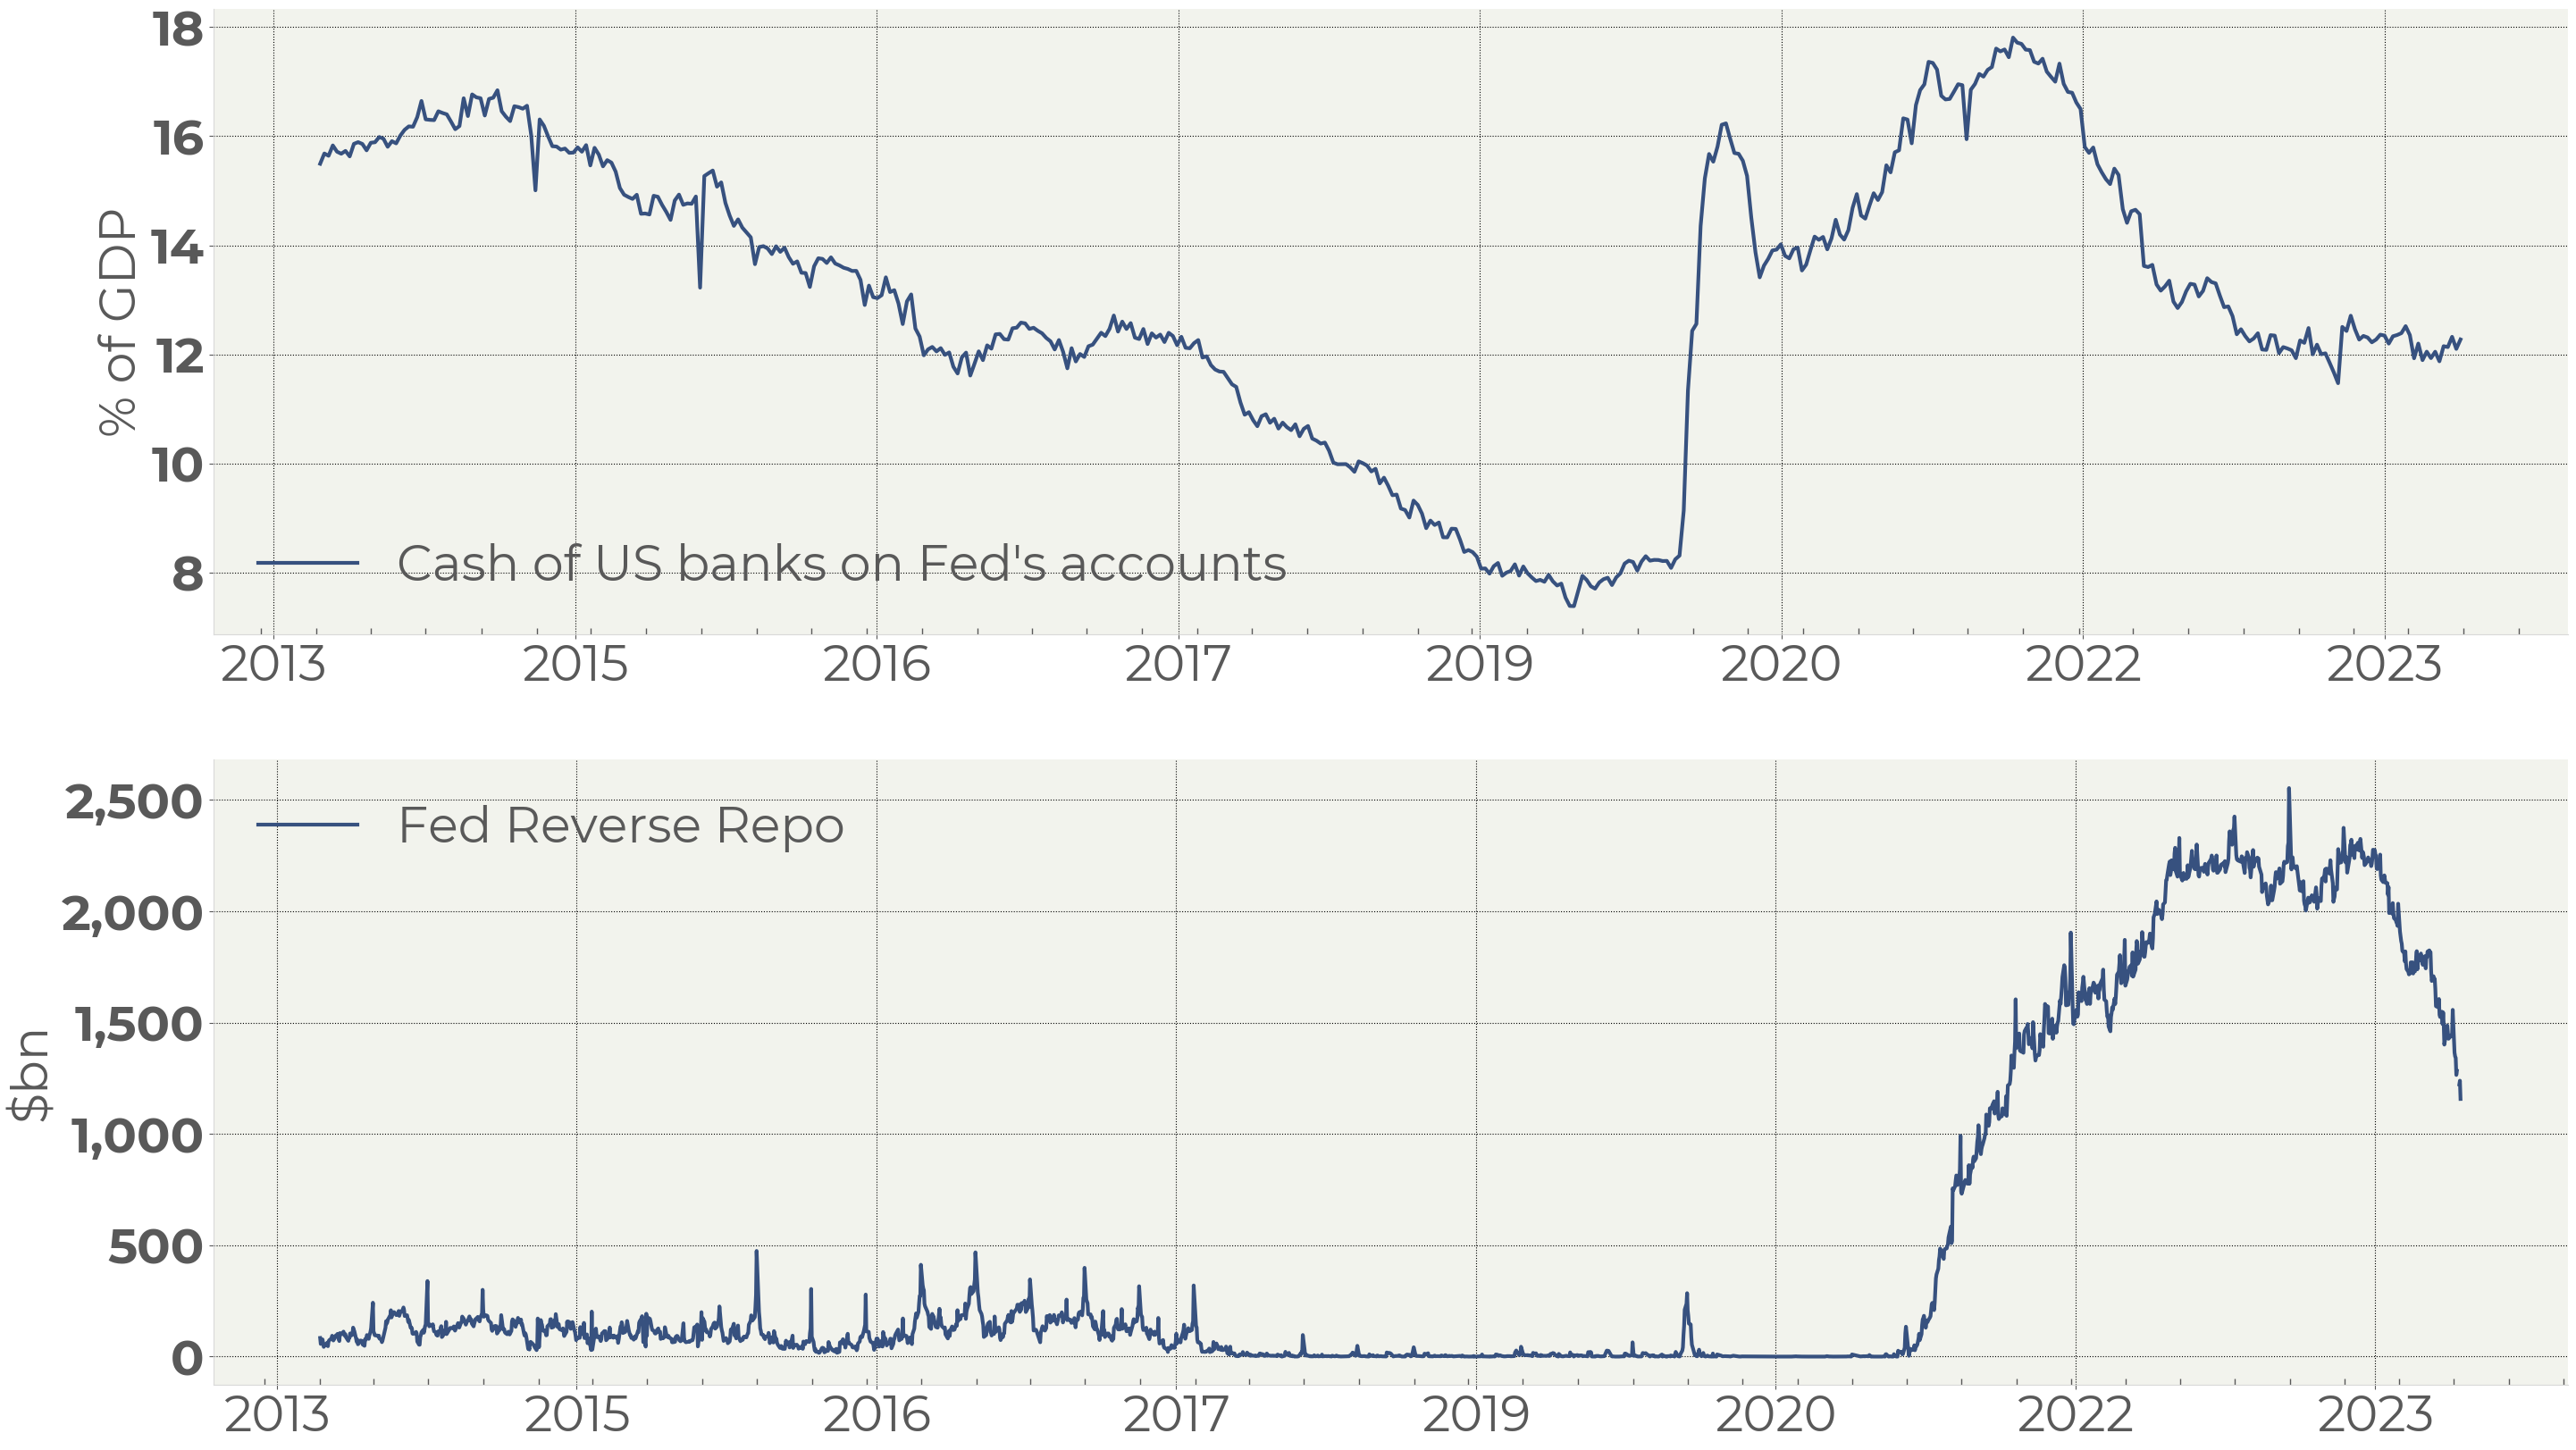
Figure 3. Cash deposited by US banks on their accounts with the Federal reserve (1)
Federal Reserve Reverse Repo value (2)
What is important is that the supply-demand balance was first influenced by the excess of banking liquidity and only then by the Fed trying to absorb this liquidity to decrease the risk of inflation.
So, the total supply-demand balance does not seem to be seriously deteriorated:
· The Treasury issuance corresponds to the pre-pandemic volume in terms of percentage of GDP.
· The Fed’s offering corresponds to the liquidity surplus of the banking sector.
In this situation, the term structure of bonds offering might be even more important than its cash value. Banks got used to holding their cash on short-term deposits counting on further key rate increases. Turning cash into bonds means taking interest risk. The Fed, selling bonds from its position, at the same time discourages banks from buying bonds, permanently pointing to further possible rate hikes.
The term structure of bond offering
Starting 2020 the US Treasury has been issuing 20Y bonds which increased the supply of the long-term bonds:
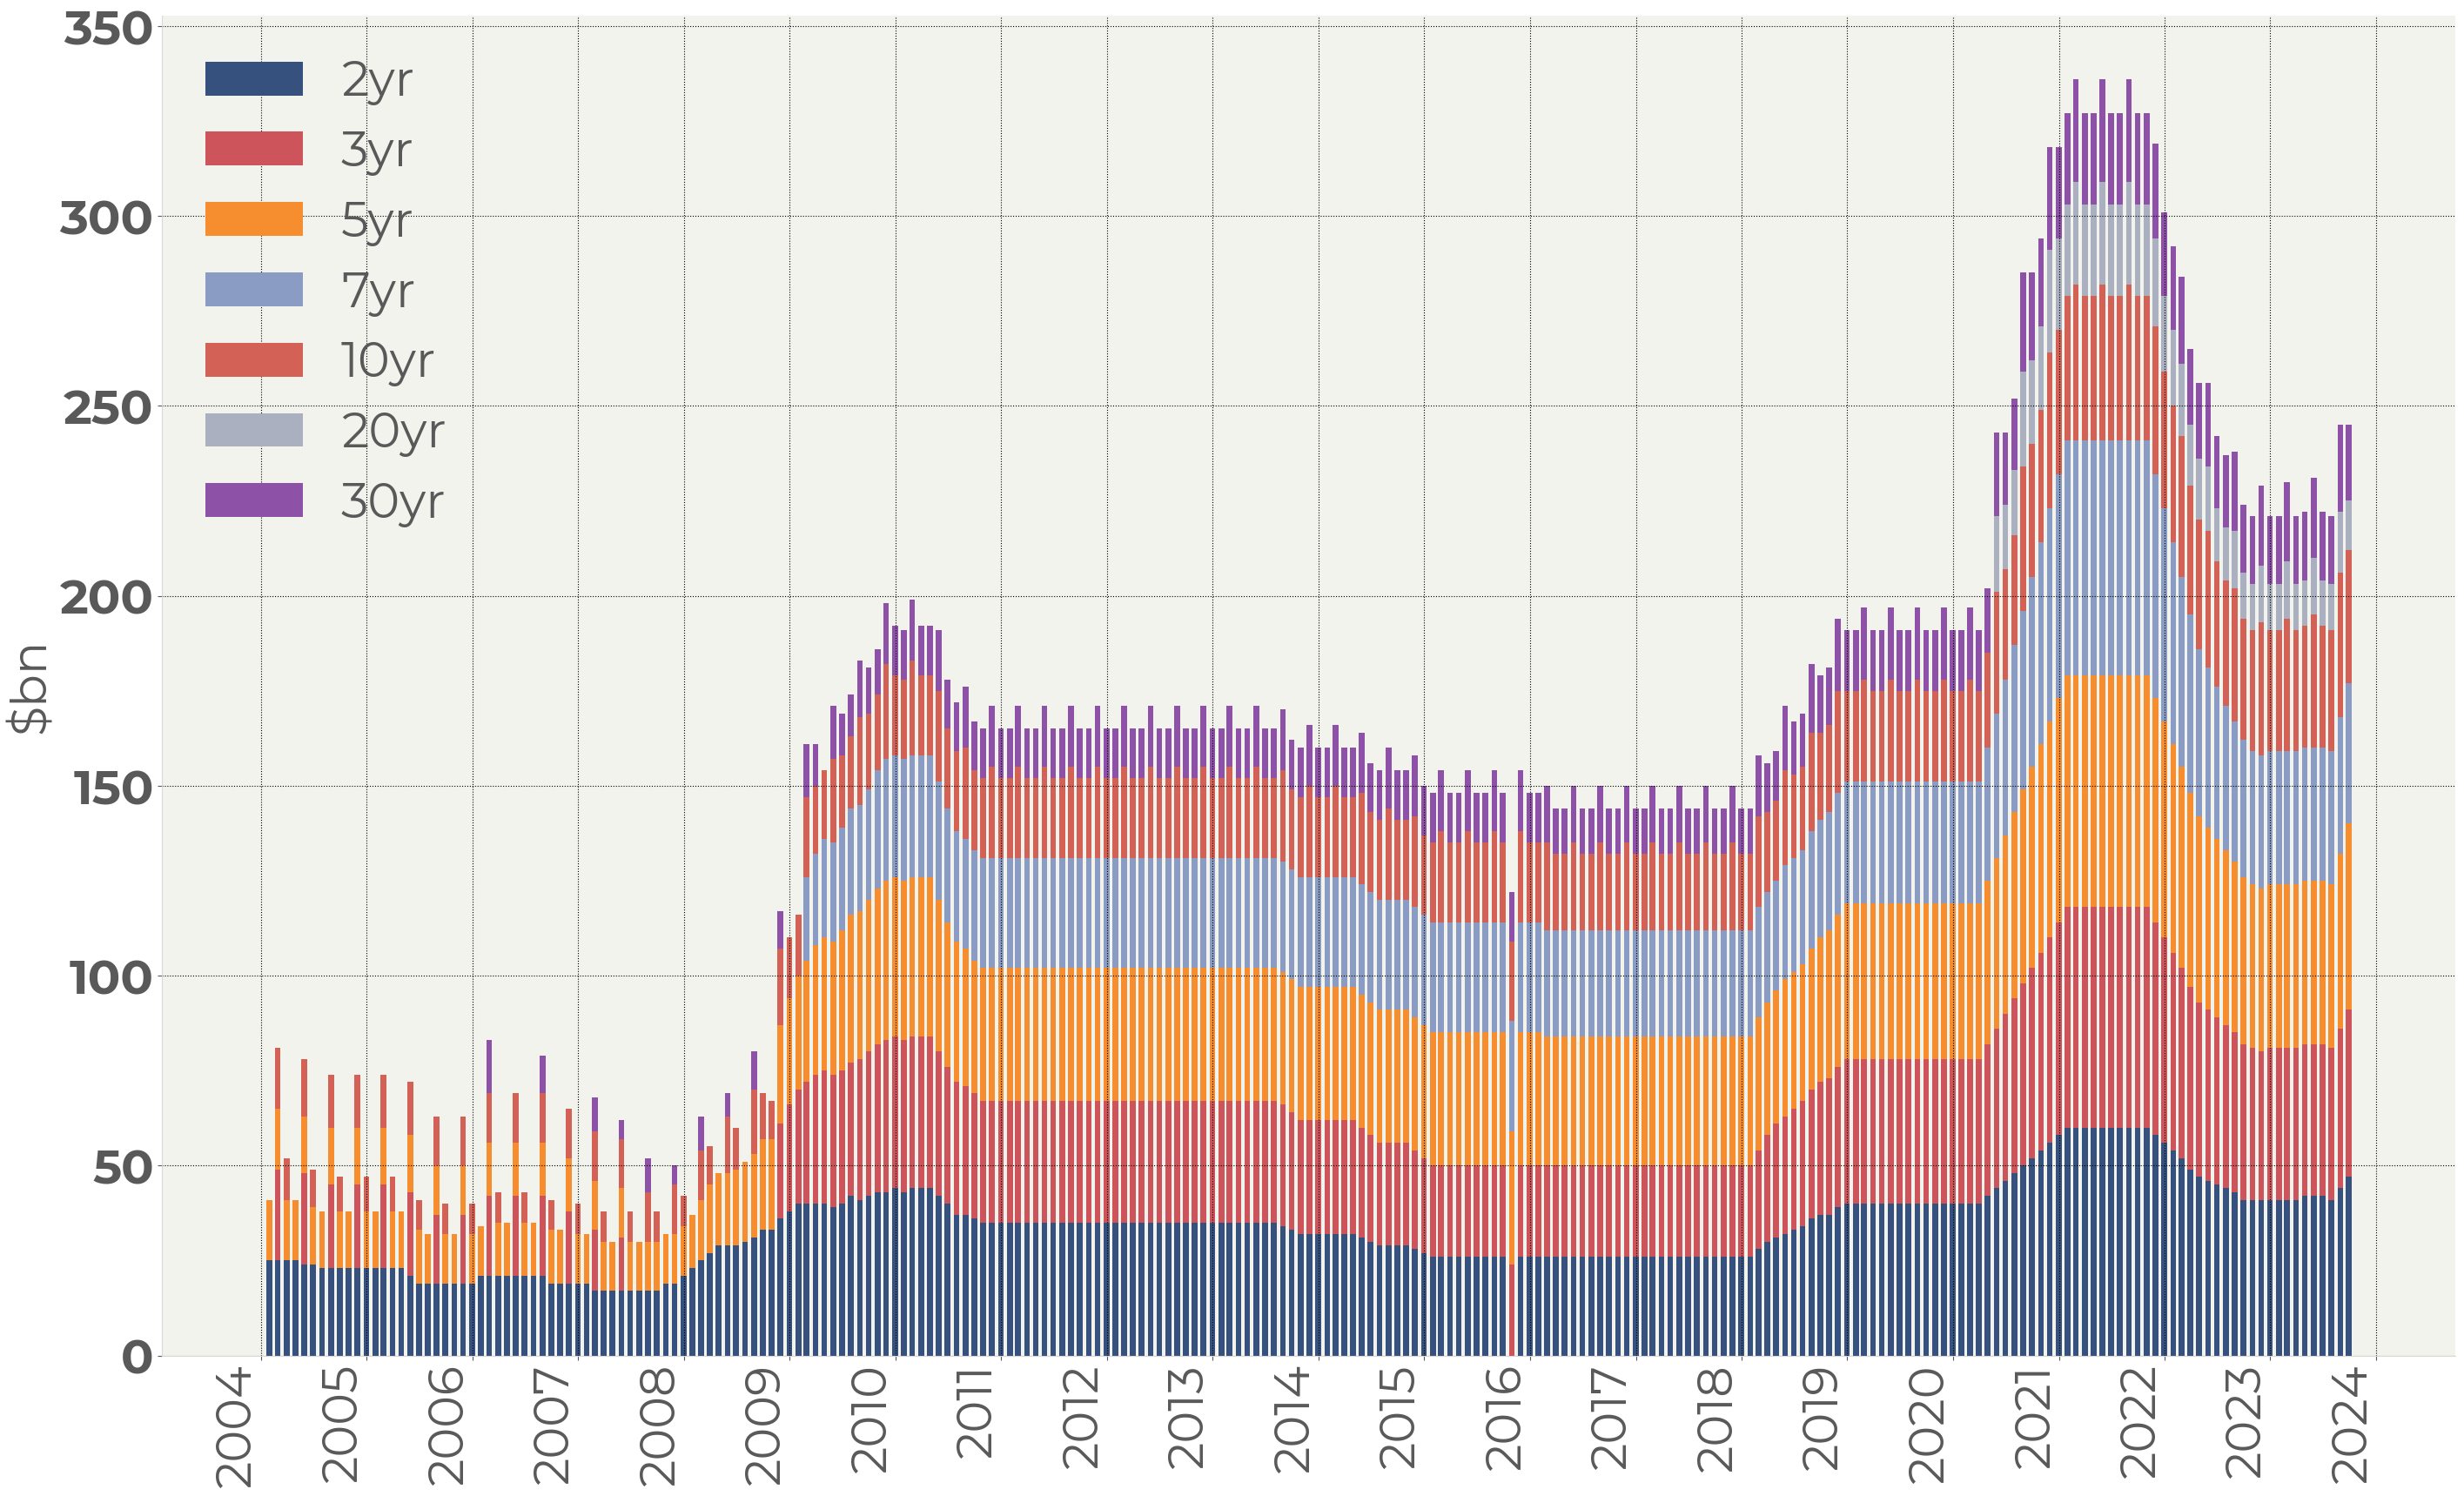
Figure 4. The maturity distribution of bond US Treasury issuance
This extra supply in the long-end curve sector is partly offset by the Fed who have bought out more than 140 billion dollars of 10Y+ bonds over the past two years (Figure 2). Doing so, the Fed eases the pressure in the long end.
This ‘Fed’ offset is only partial, though. The total supply of bonds has become ‘longer’ with the share of long-term bonds increased from 8% to 14% of the total bond issuance:
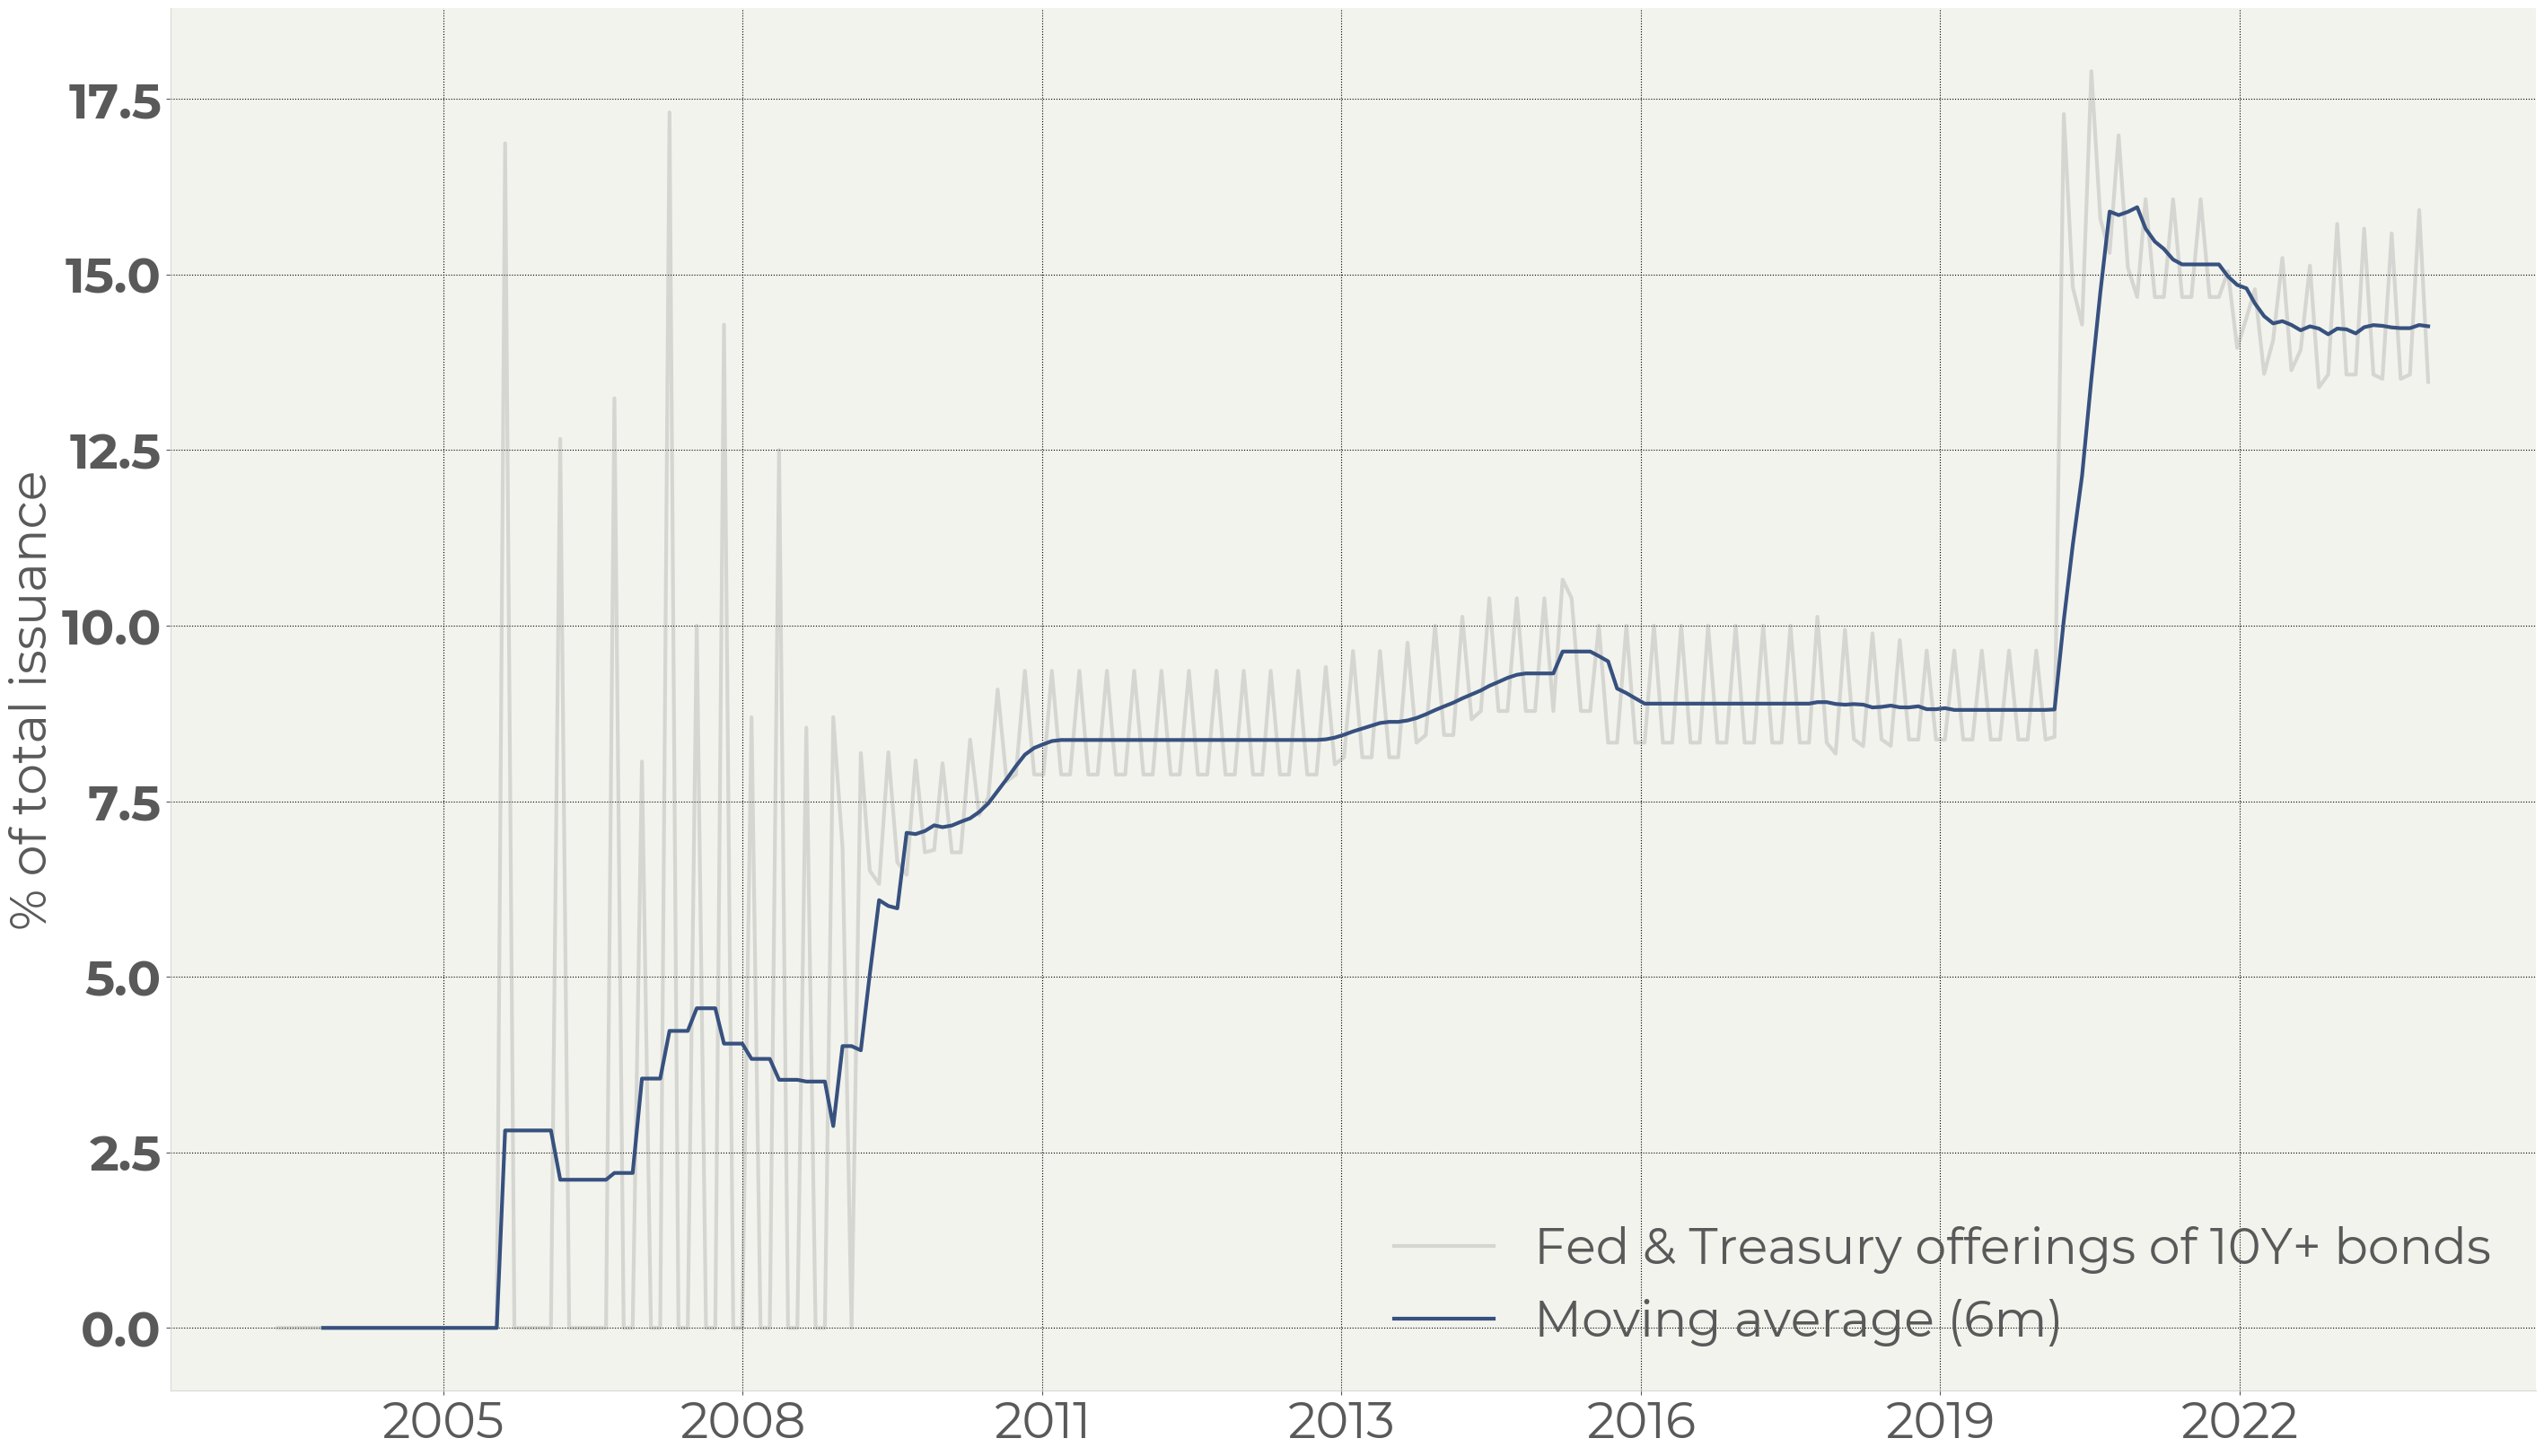
Figure 5. Share of long-term US Treasury bonds offering
Potential demand for the long-term bonds
Besides the changes in the supply of long-term bonds, the structure of demand has also changed. Traditional buyers in the long-term bond curve – pension funds, mutual funds, insurance companies – experienced substantial inflows (Figure 7).
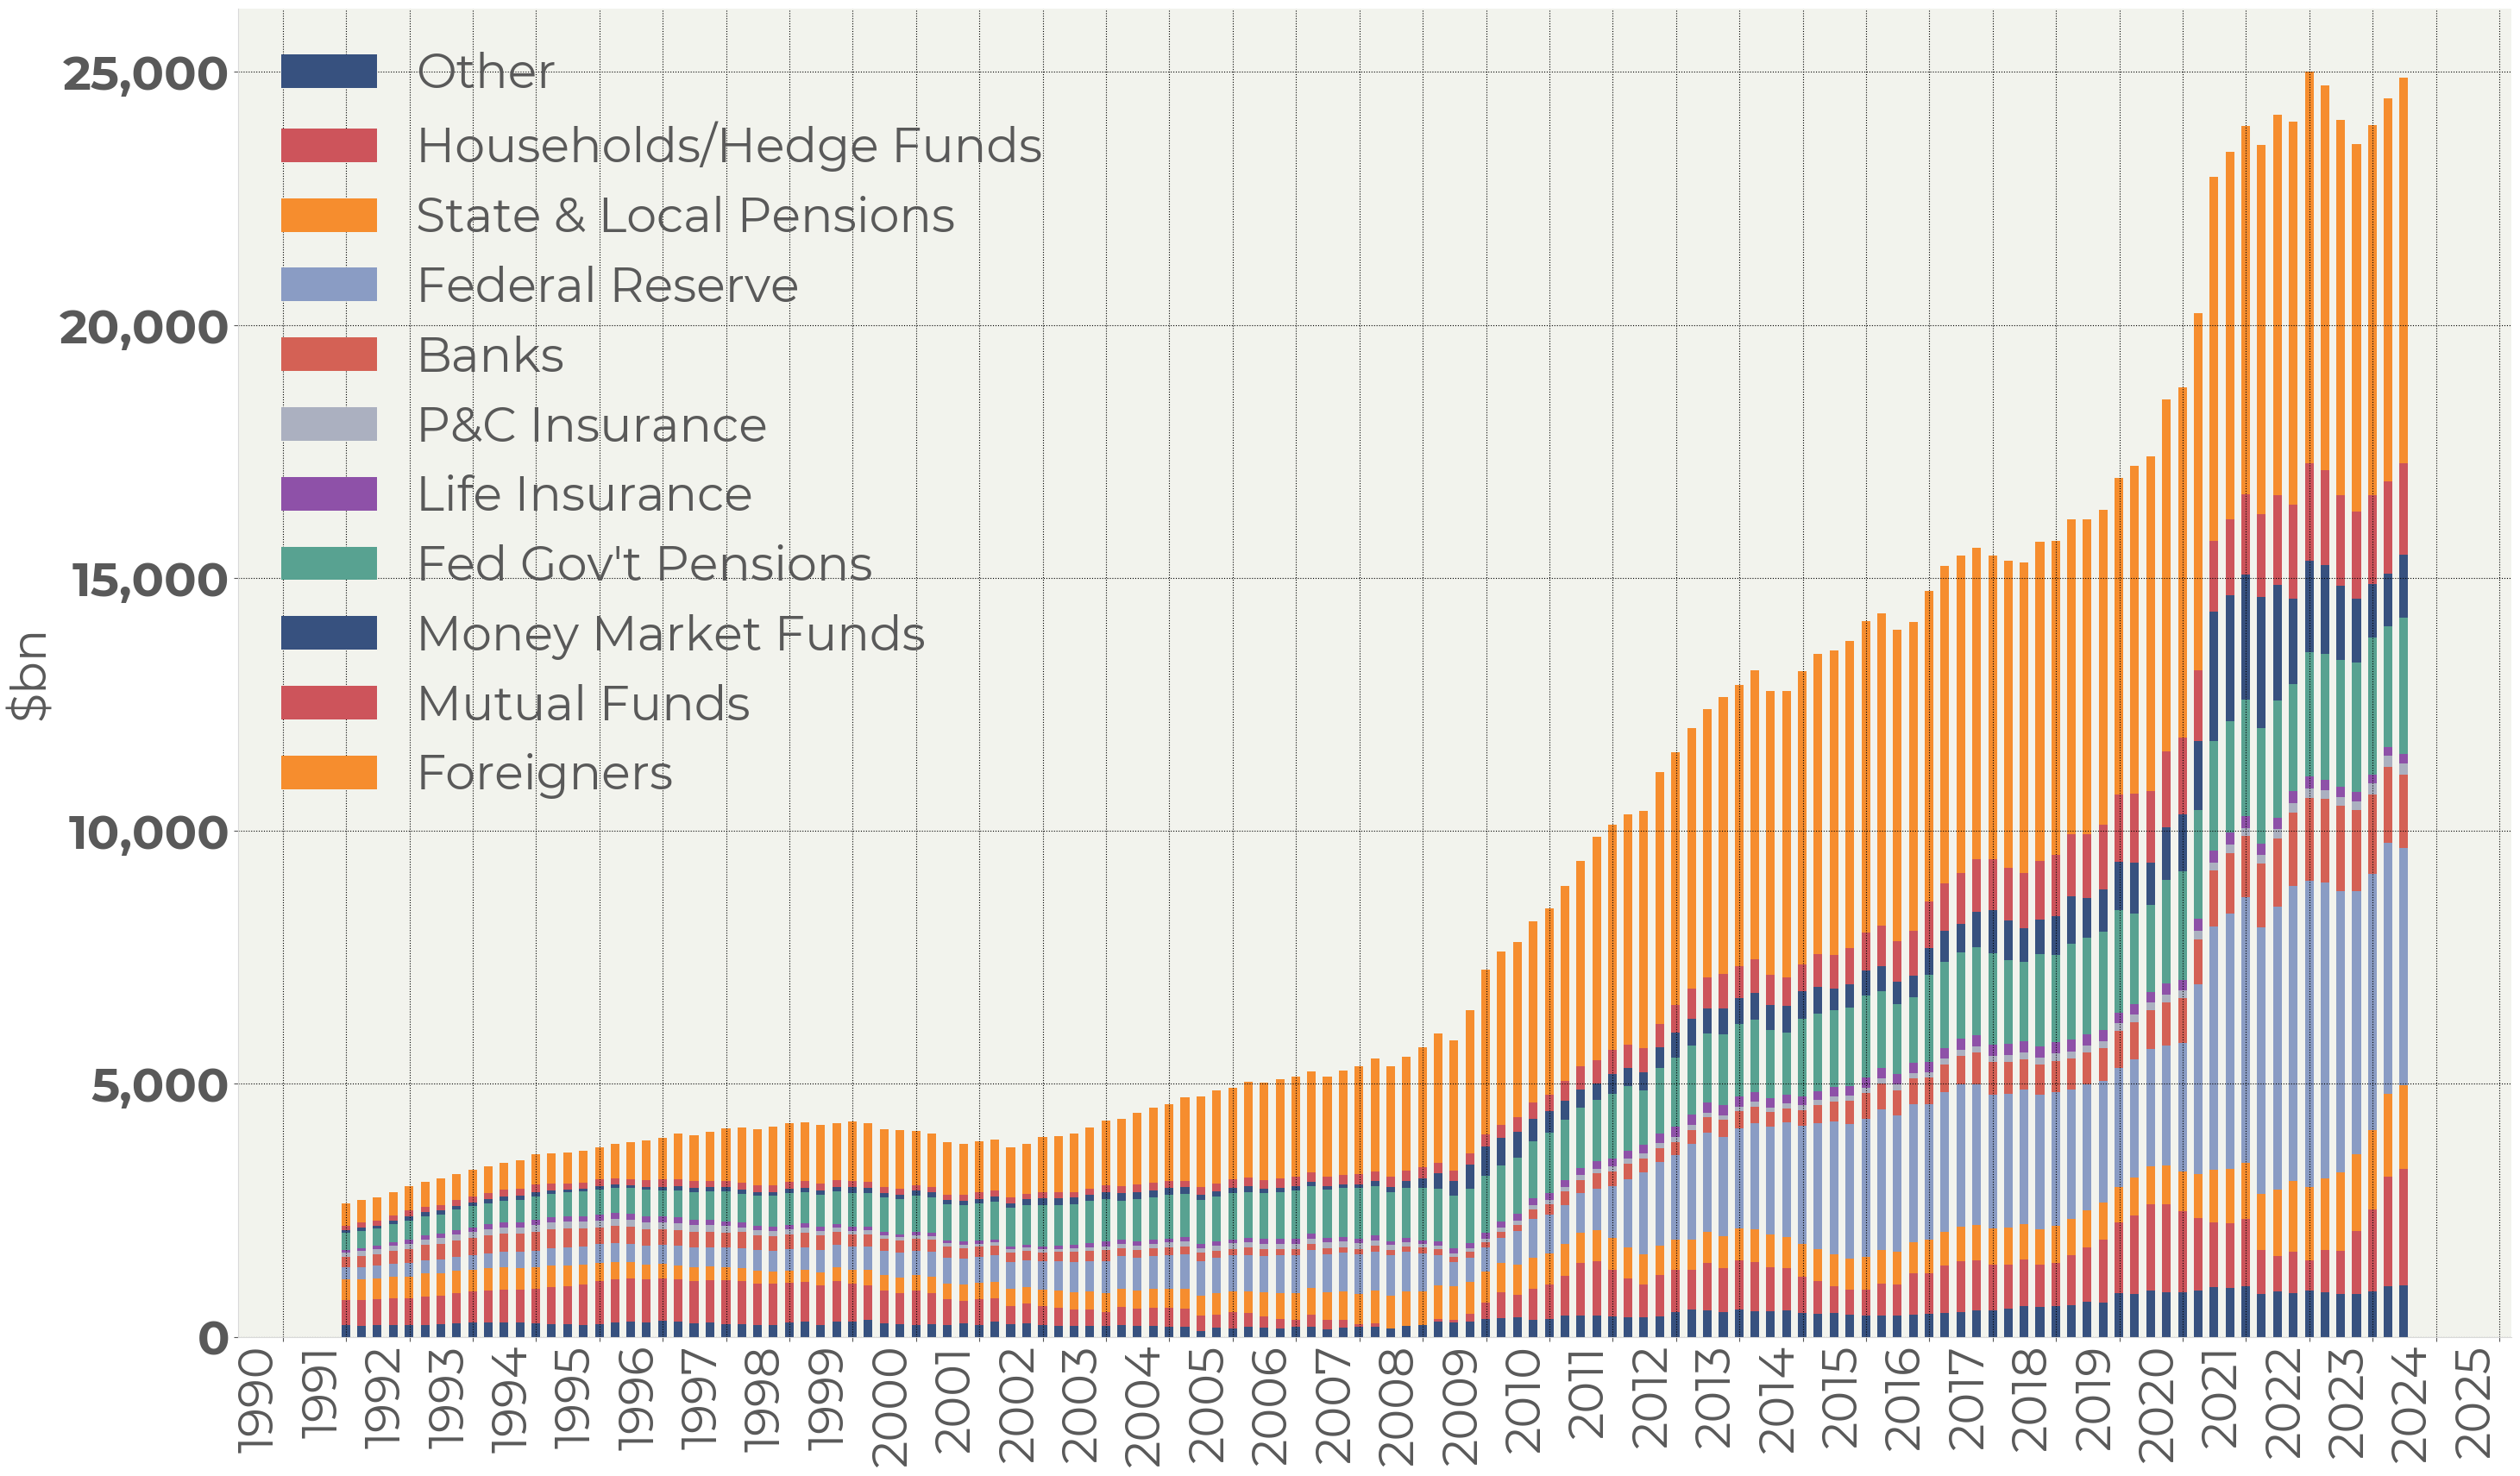
Figure 6. Treasury holdings by investors
Figure 7 demonstrates the total value of assets of:
· State & Local Pensions,
· P&C Insurance,
· Life Insurance,
· Mutual Funds:
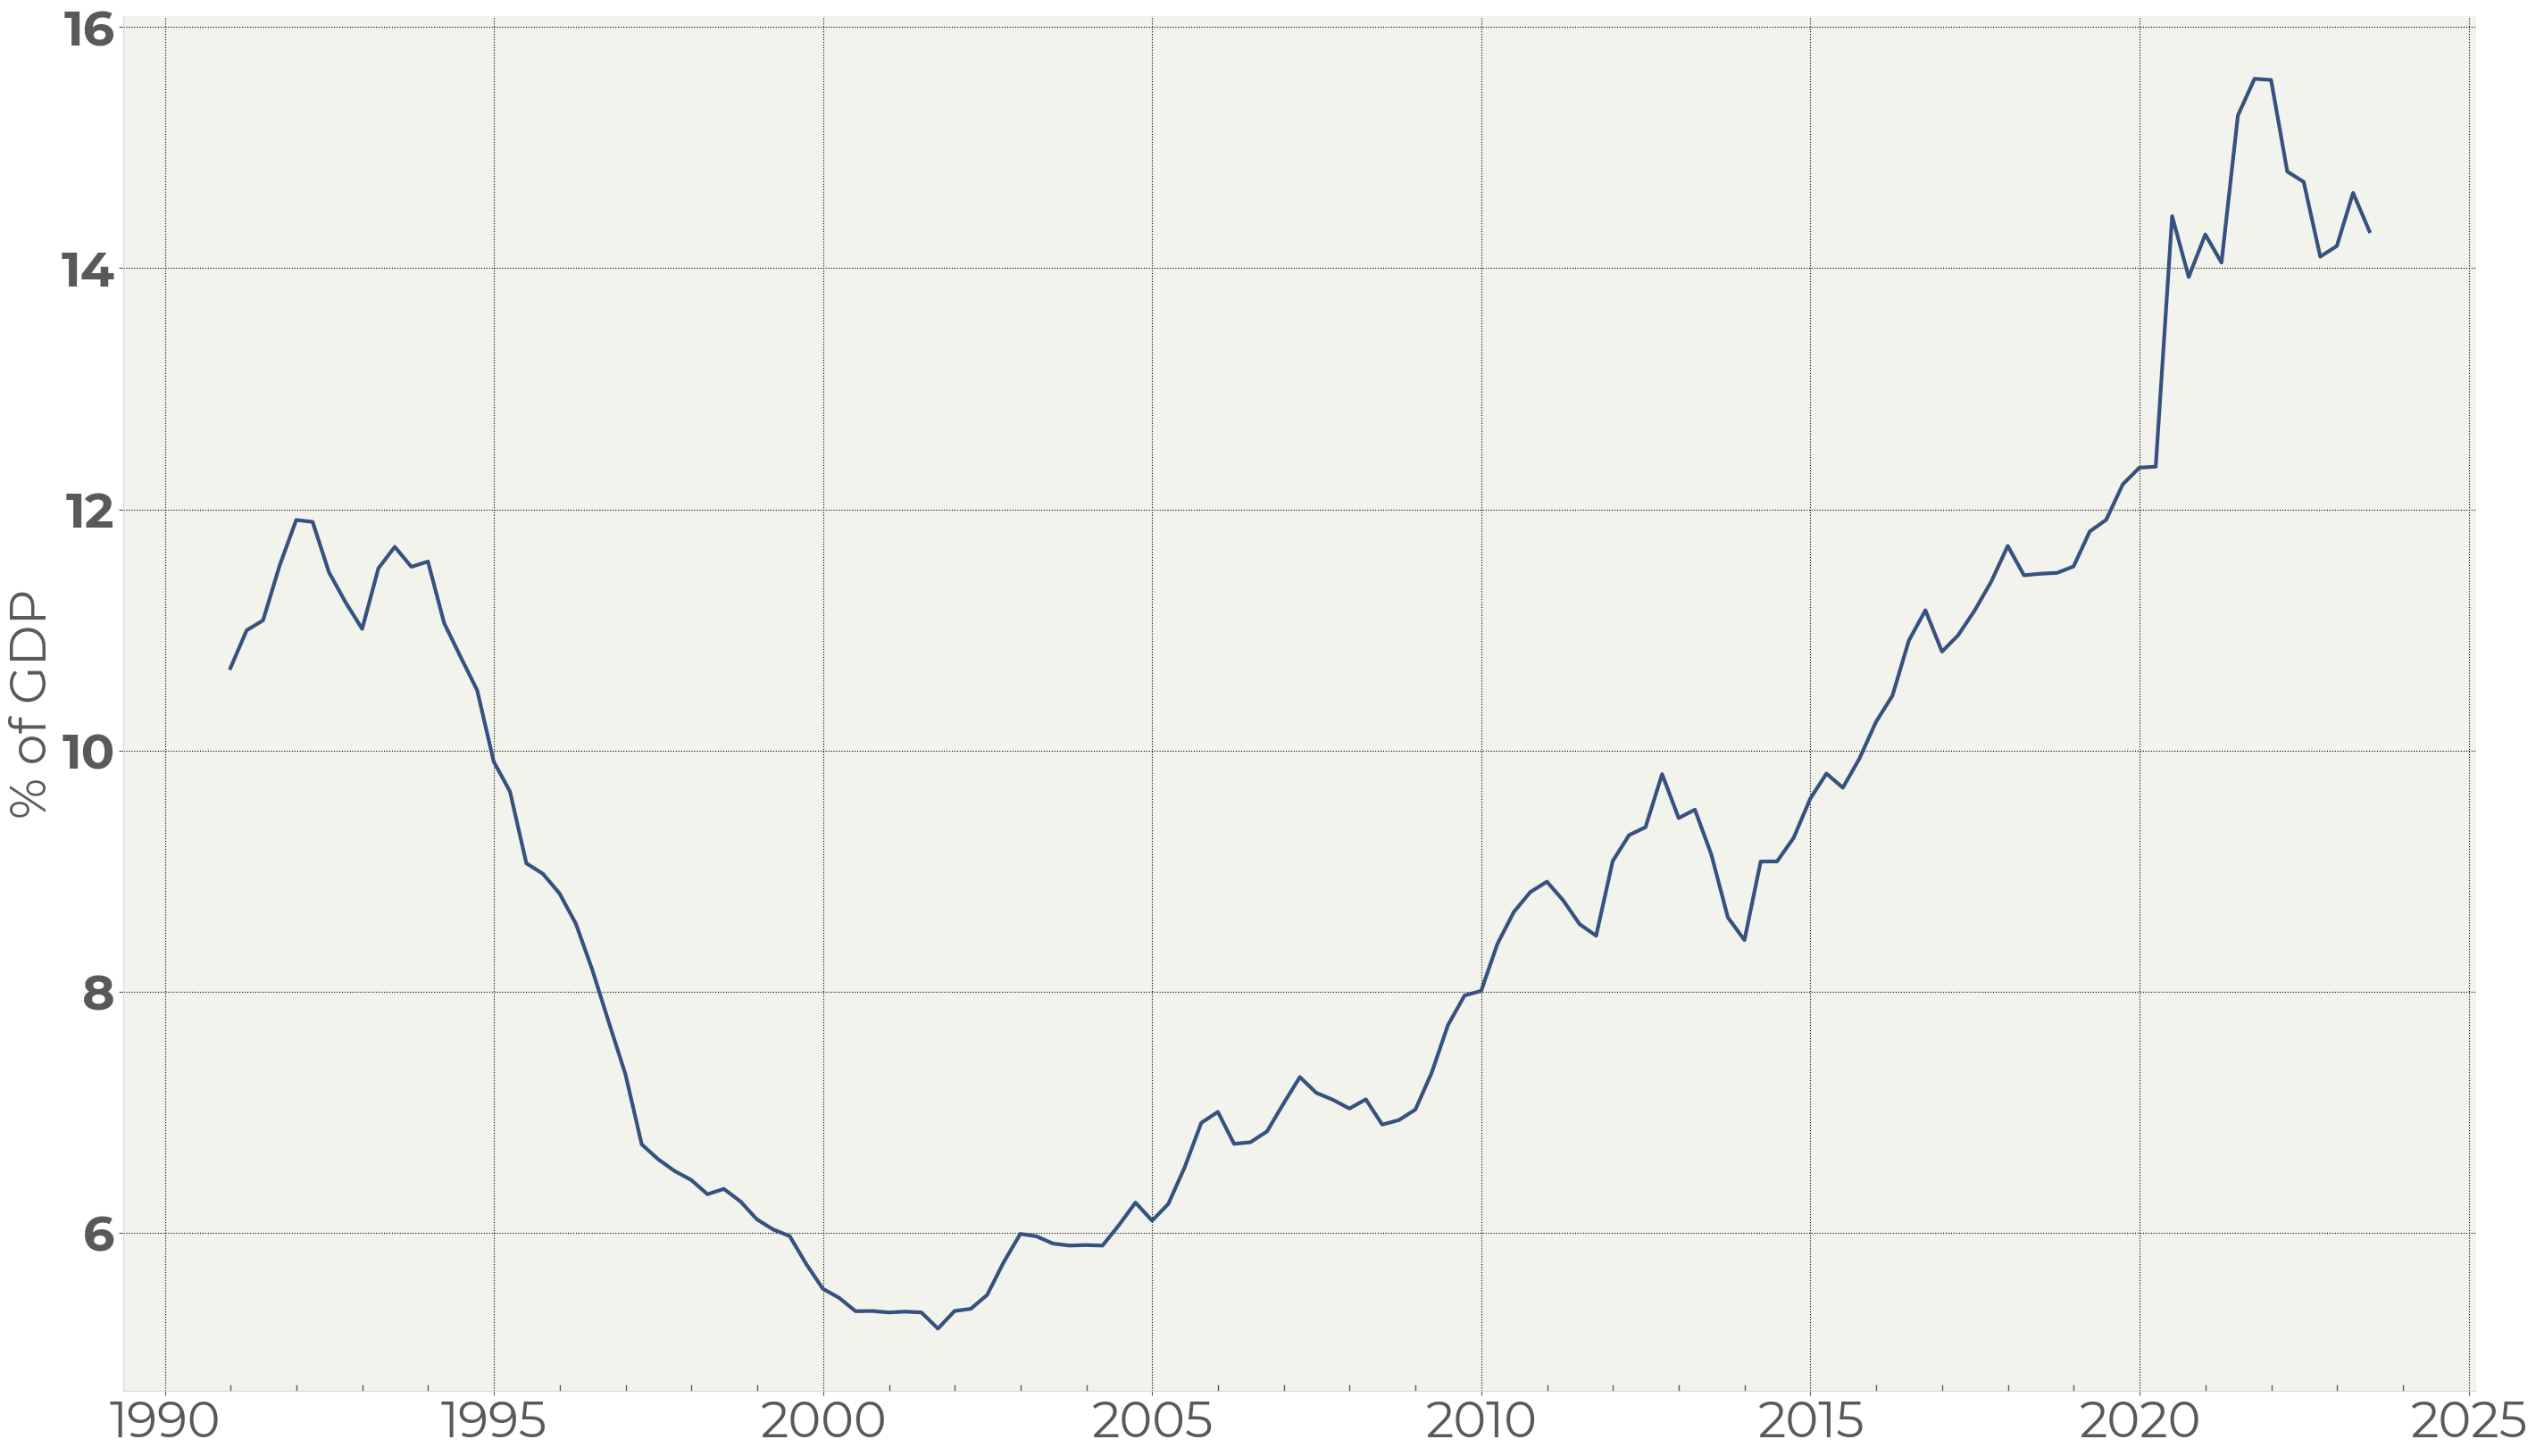
Figure 7. Strategic buyers of US Treasury bonds
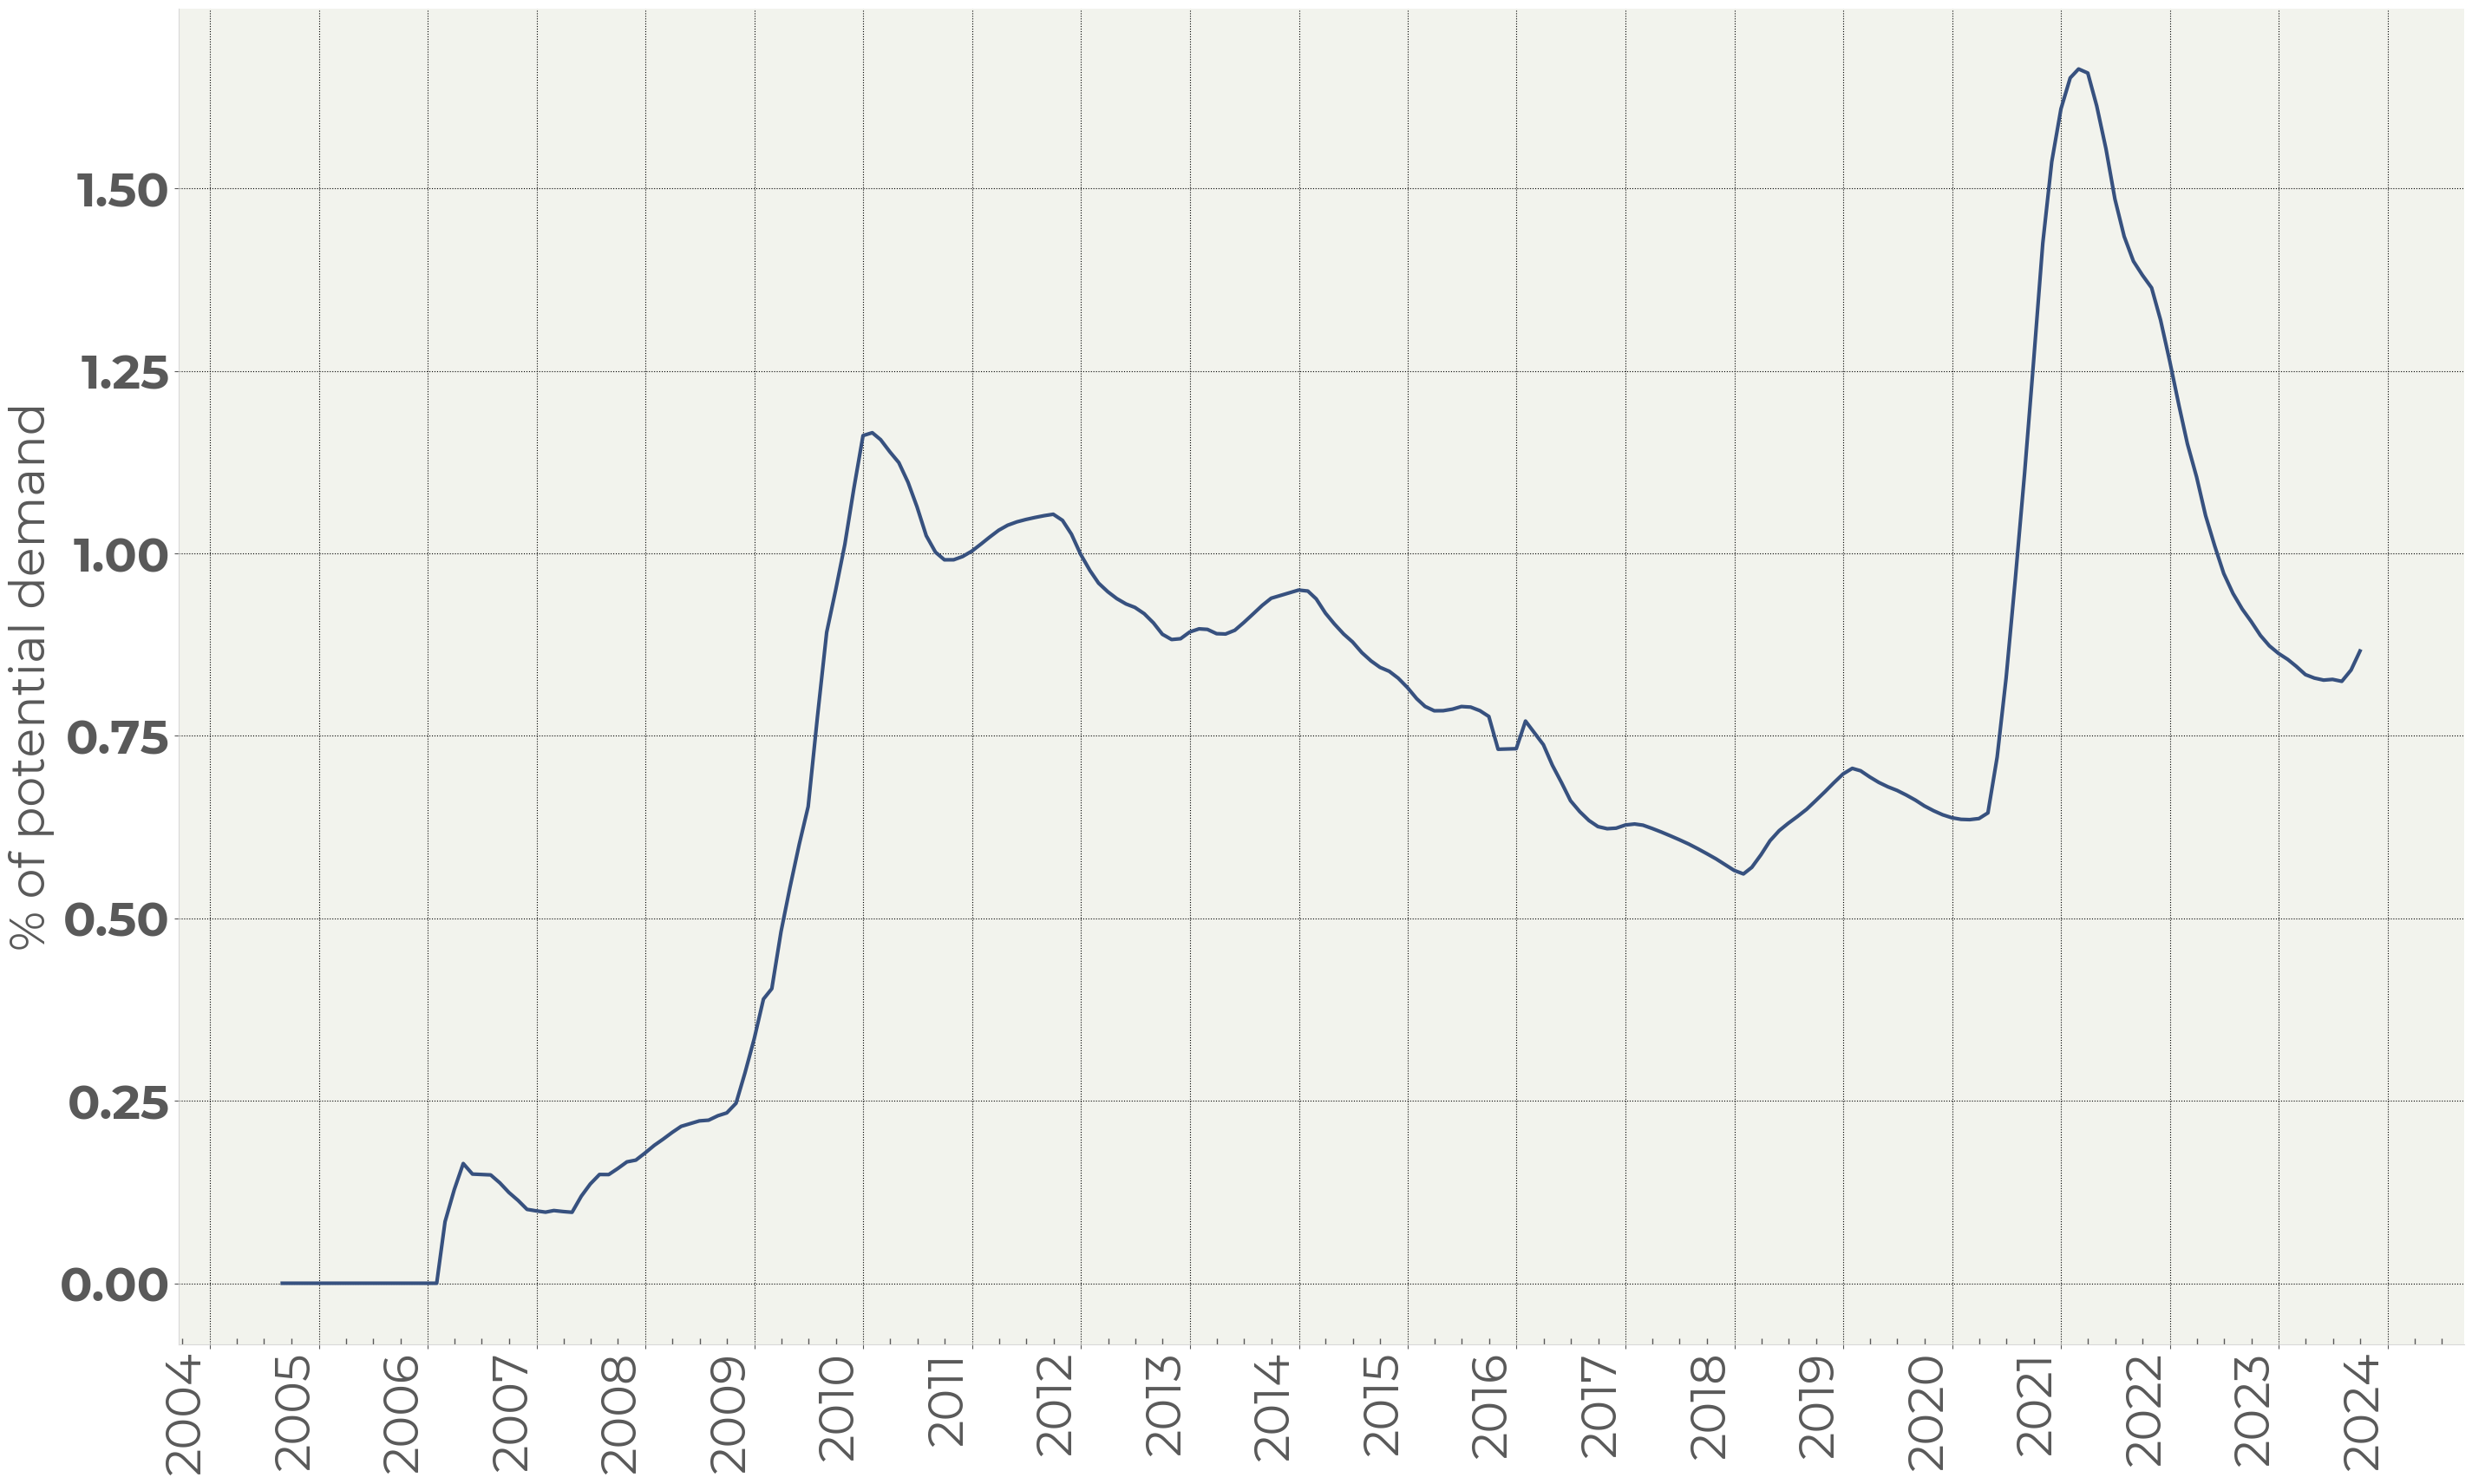
Figure 8. Long-term bonds US Treasury issuance to total value of strategic buyers ratio
So, a larger offering of long-term bonds meets a larger buying potential from the side of strategic buyers.
We should recognize the fact that the duration shift in bond offering seems to be permanent while the change in the demand structure is caused by the temporary factors.
To sum up, we do not see current imbalances in the supply-demand structure in the US government bond market, but investors take it seriously that such imbalances will occur in future.
Credit quality of the United States
It is widely discussed that the credit quality of the US is deteriorating, and this seriously affects the bond market. Chaos in Congress, the budget deficit, the debt ceiling issue, ongoing wars, the sanction politics pushing traditional buyers on US debt away – all those things reduce the appetite for the US bonds.
Credit quality can be measured, though. Figure 9 shows the spreads between market instruments, containing the credit risk, and Interest rate swaps that are by nature are less risky.
For Europe we took the interbank rate because the EU bonds do not exist. In 2008 and 2012 its spread over OIS expanded 50bp.
For the US we compare ten-year government bonds and OIS (Figure 9). Although this spread has gone up, until now it has not signaled an uptick which would be significant enough to take it into account.
Another argument against credit risk being a major factor for bonds is that the German bond market behaves similarly while its credit quality with the Debt/GDP ratio standing at 68% level is much better than the US one (of course, if we consider the debt level as a major factor determining the credit quality, which is not fair, strictly speaking).
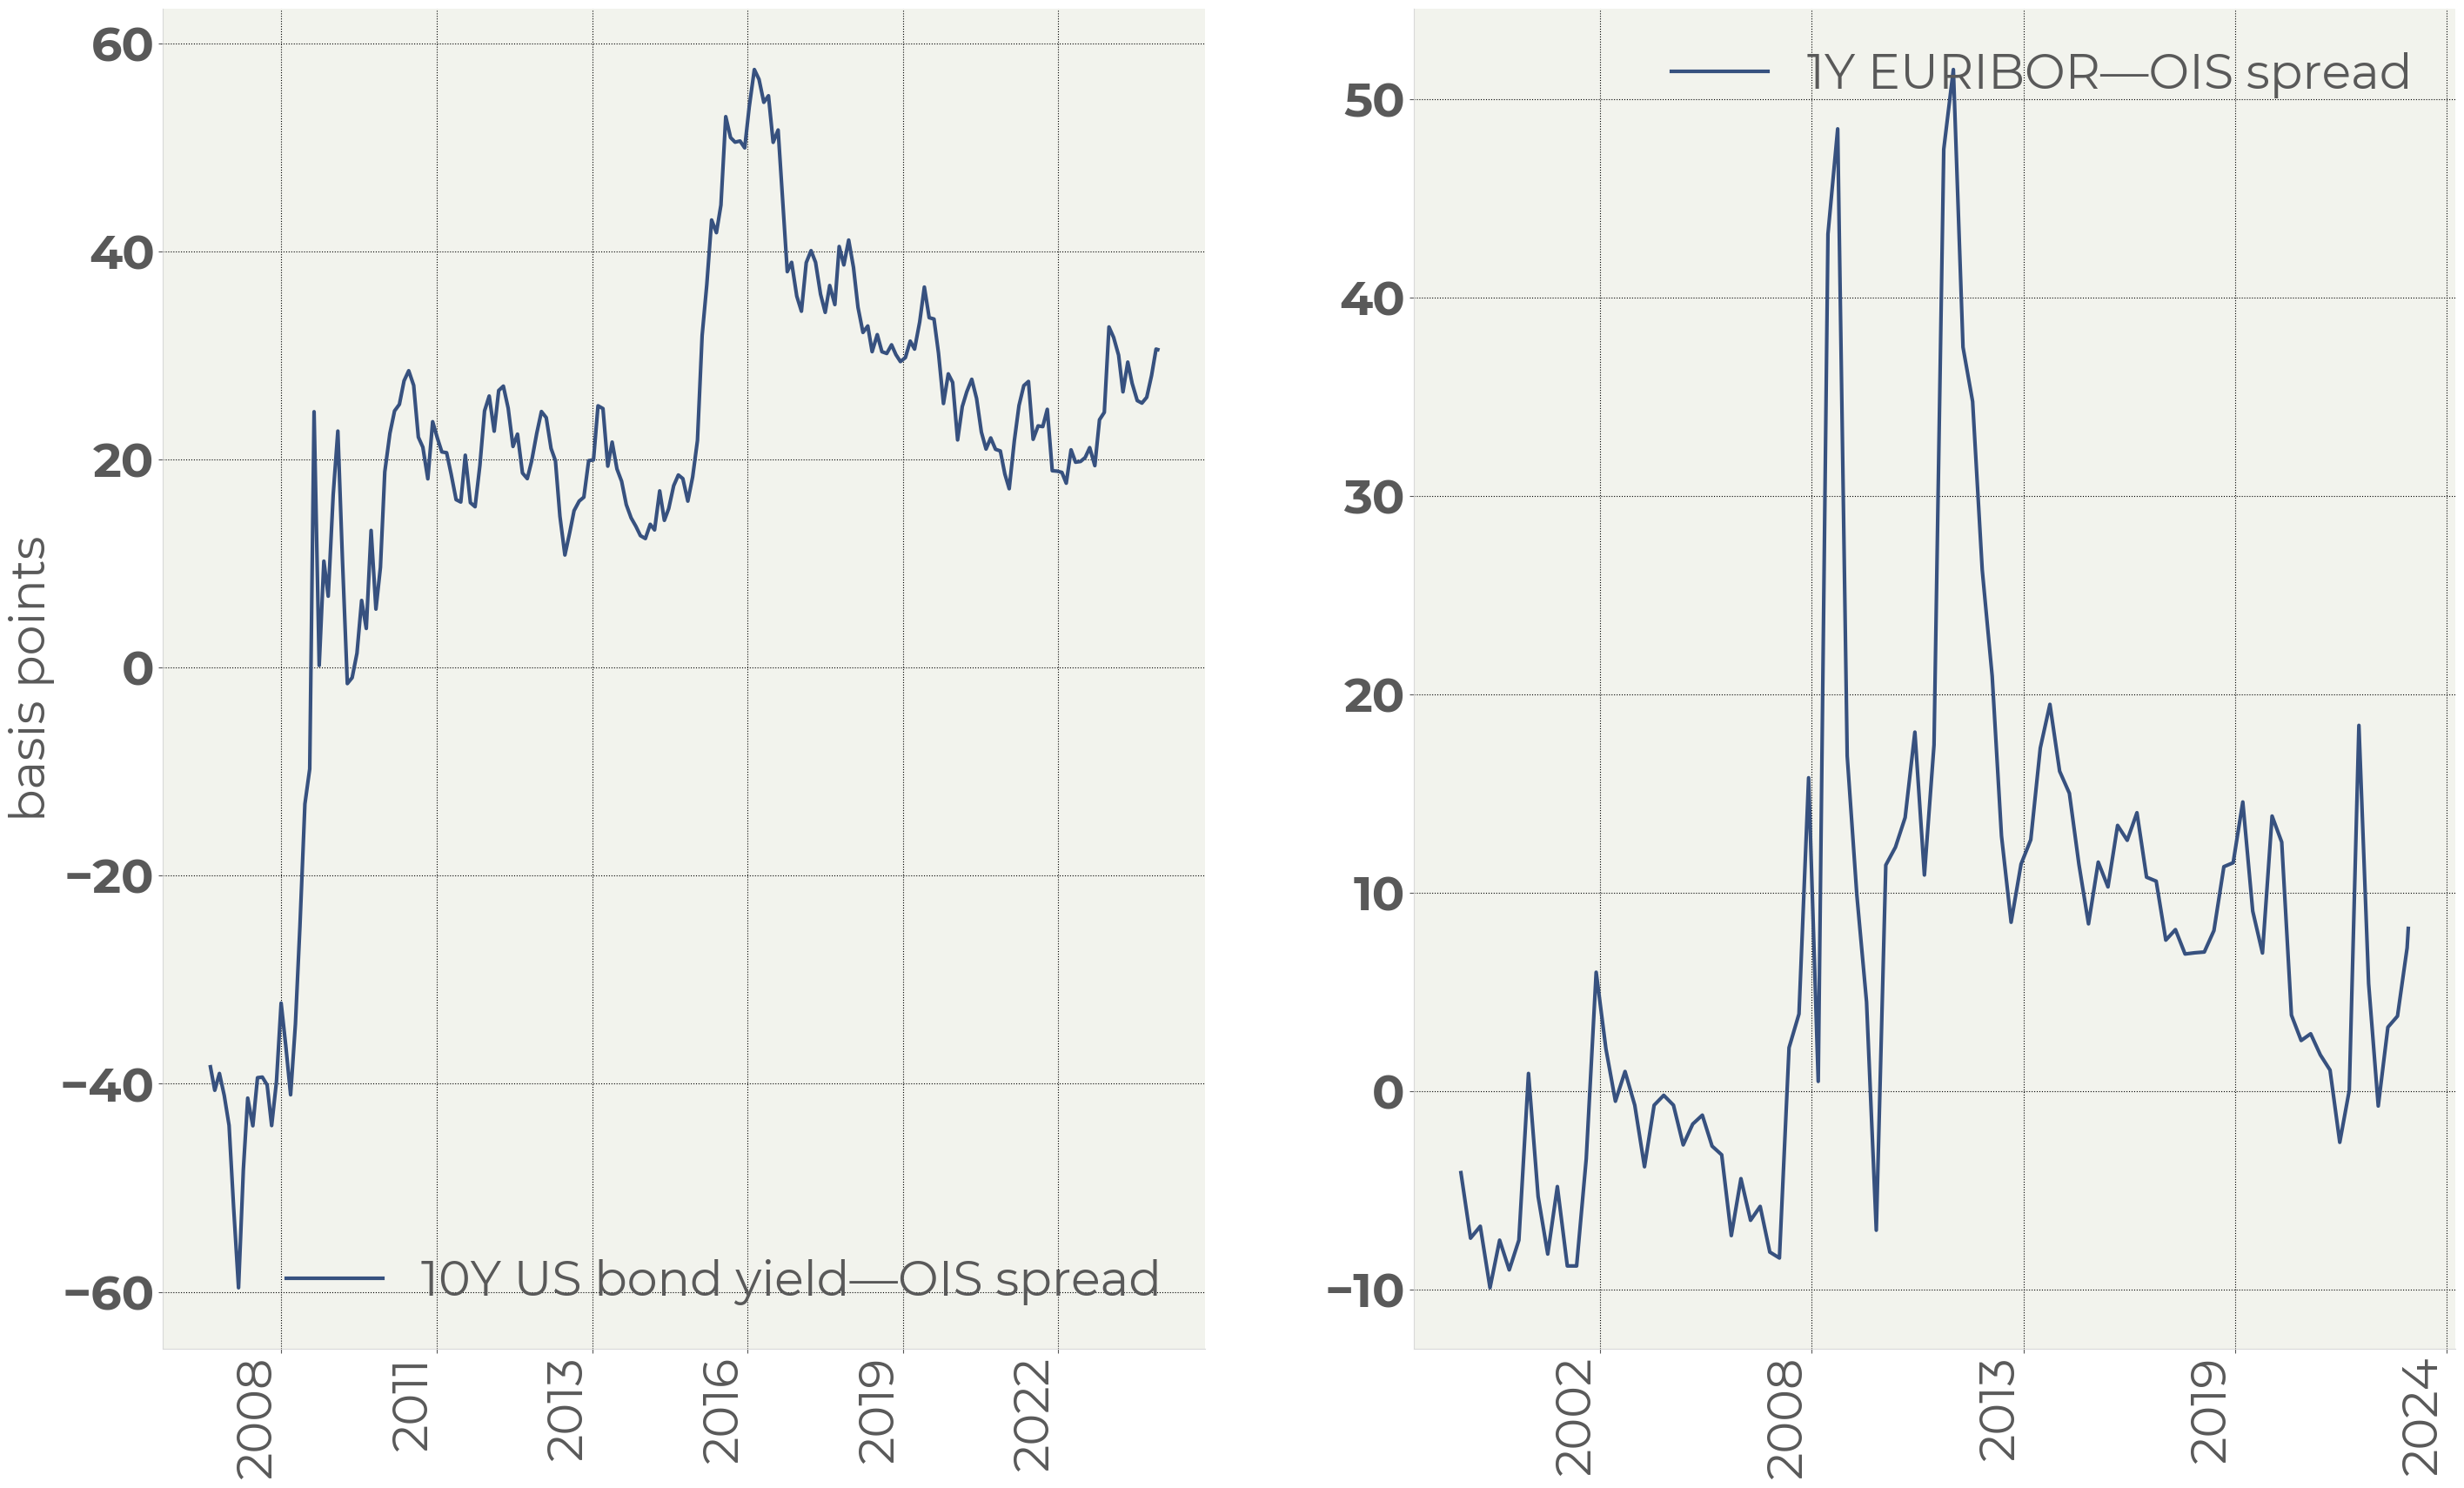
Figure 9. Credit spreads of bonds in US (1) and EU (2)
Government refinancing issue
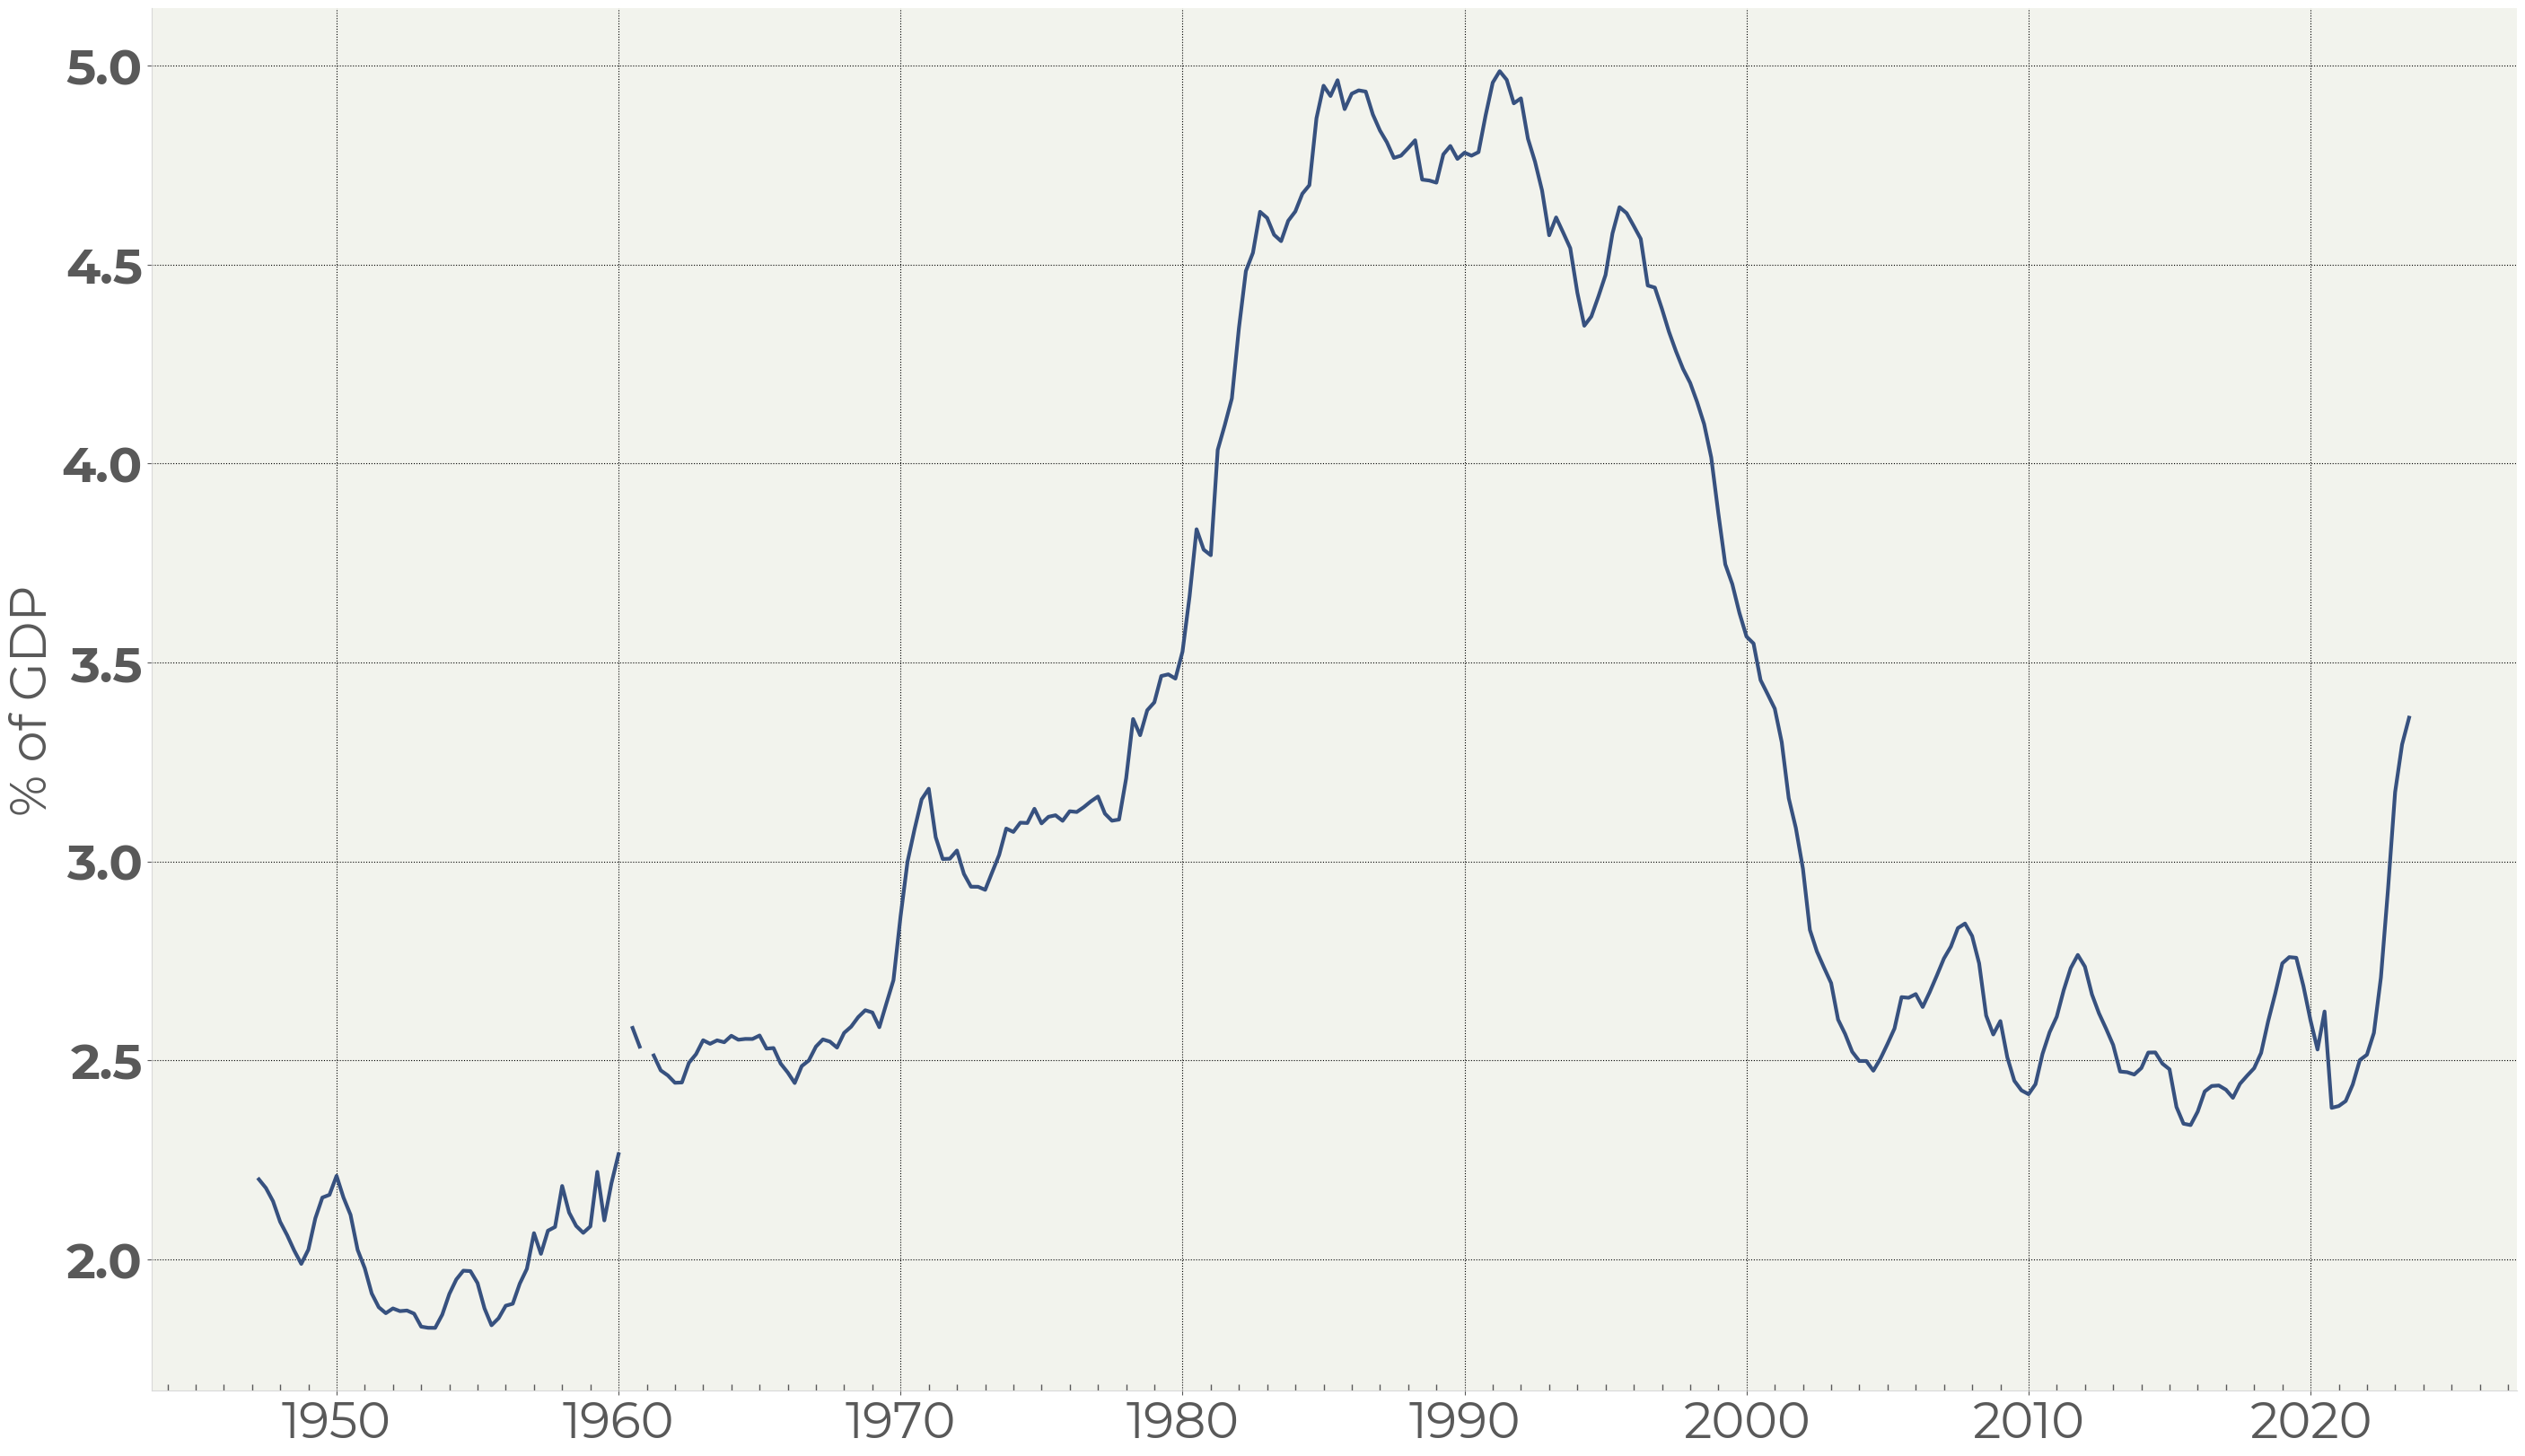
Figure 10. US Government debt interest payments
The increased level of interest rates leads to gradual increase in interest payments by the US Government (Figure 10). Since the Fed rate strategy will remain unchanged for some time, the interest payments are likely to reach 4—4.5% of GDP within a year. It is not likely that the Government spendings will decrease, hence we will see soon inflated bonds issuance aimed at covering the interest payments.
It is worth noting that the previous period of high interest payments in 1980—1990s both the bond and the equity markets were growing.
Concerning the current situation, we can expect an increased level of rates over the two next years. Therefore, the Government is going to borrow extra 6—8% of GDP in years to come.
The extra borrowings will send the US debt-to-GDP ratio to circa 80% from the current 73.75% (Figure 11)1.
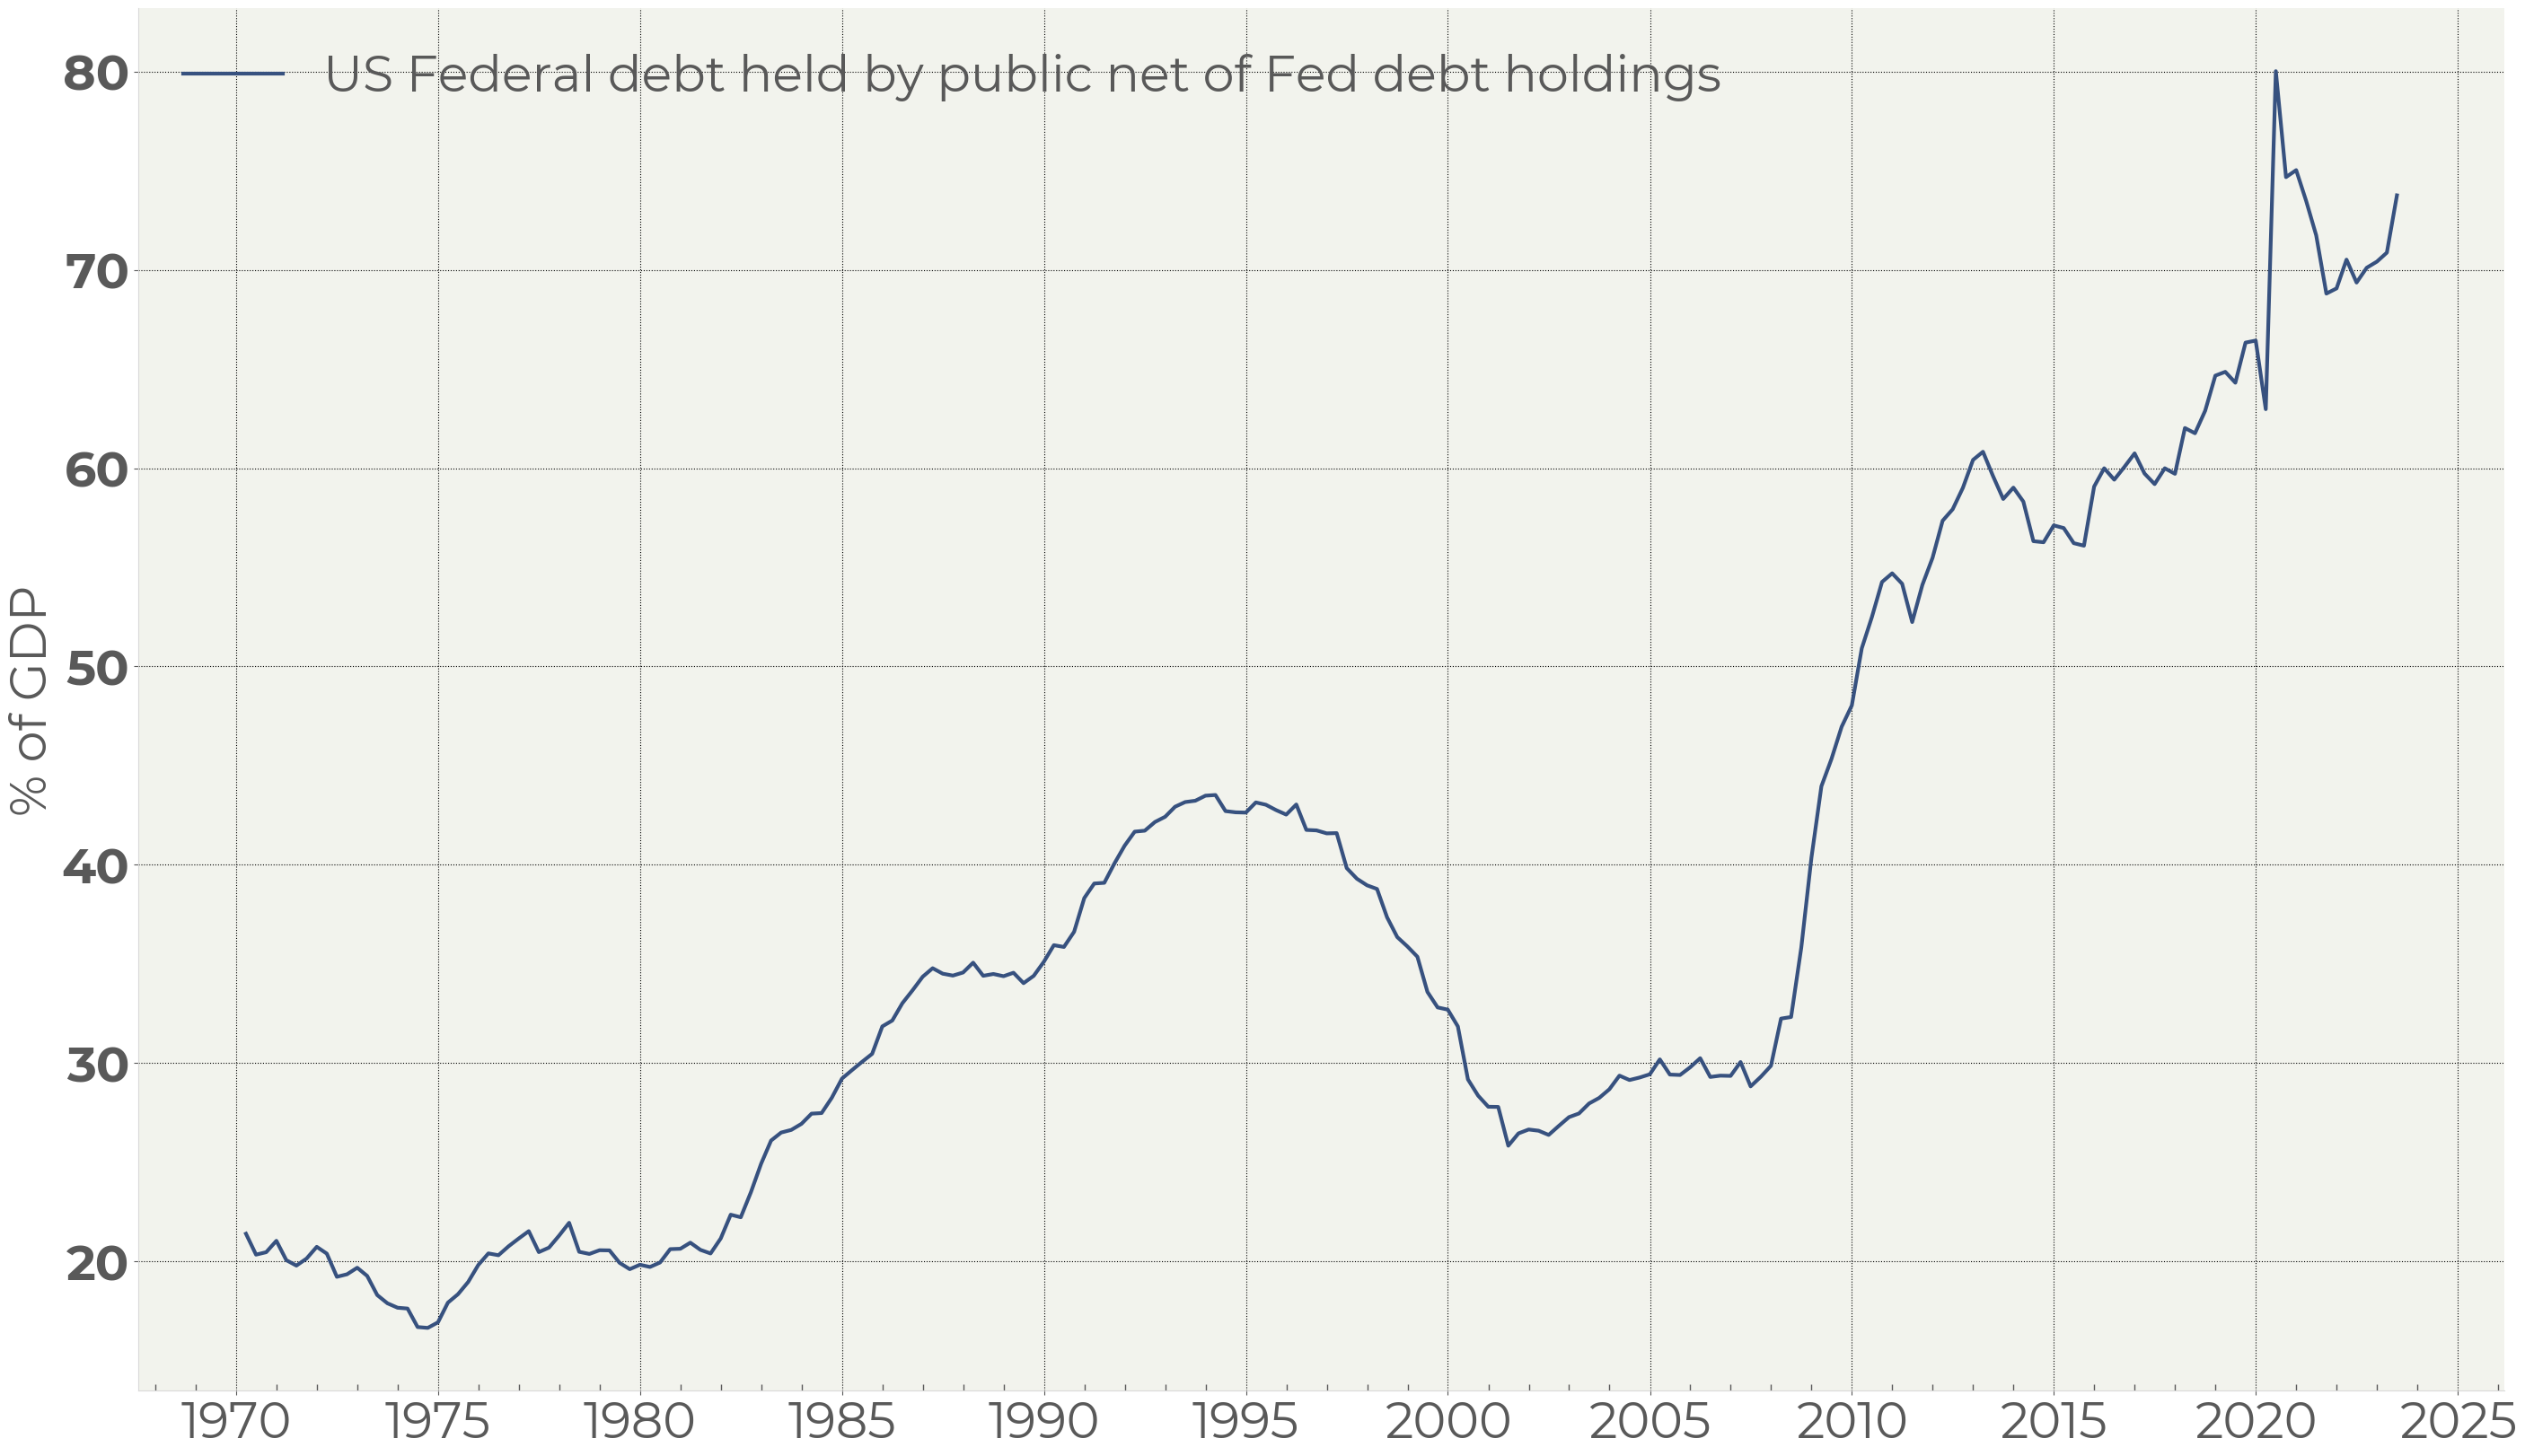
Figure 11. US Federal debt held by public net of Fed debt holdings
This debt rise represents a small pattern of the long-lasting uptrend in the US debt which, without a doubt, worries investors. However, it is hard to prove that the current level of debt is crucial. We would also notice that the US credit spread (bonds over swaps) and the equity market do not see a risk here. The first signs of instability in the bond market should, in our view, crash equities.
We assume, therefore, that the debt level argument is sooner a rationalization than an actual cause of the bond market drawdown.
Foreign holders of US debt
The surge of Emerging Market countries investments in the US debt happened as a reaction to the broad emerging markets currency crisis of 1997—1999. That crisis was caused by massive investments in emerging market economies which drove their local currencies to strongly overheated levels.
It led to the shift in EM countries’ currency policies. A common perception was that the best medicine against possible currency crises is avoiding situations where a local currency gets overpriced. A technical tool for that became forming currency reserves. Buying dollars and US bonds local central banks offset huge hard currency inflows on the backdrop of the emerging markets boom, not letting local currencies go too high.
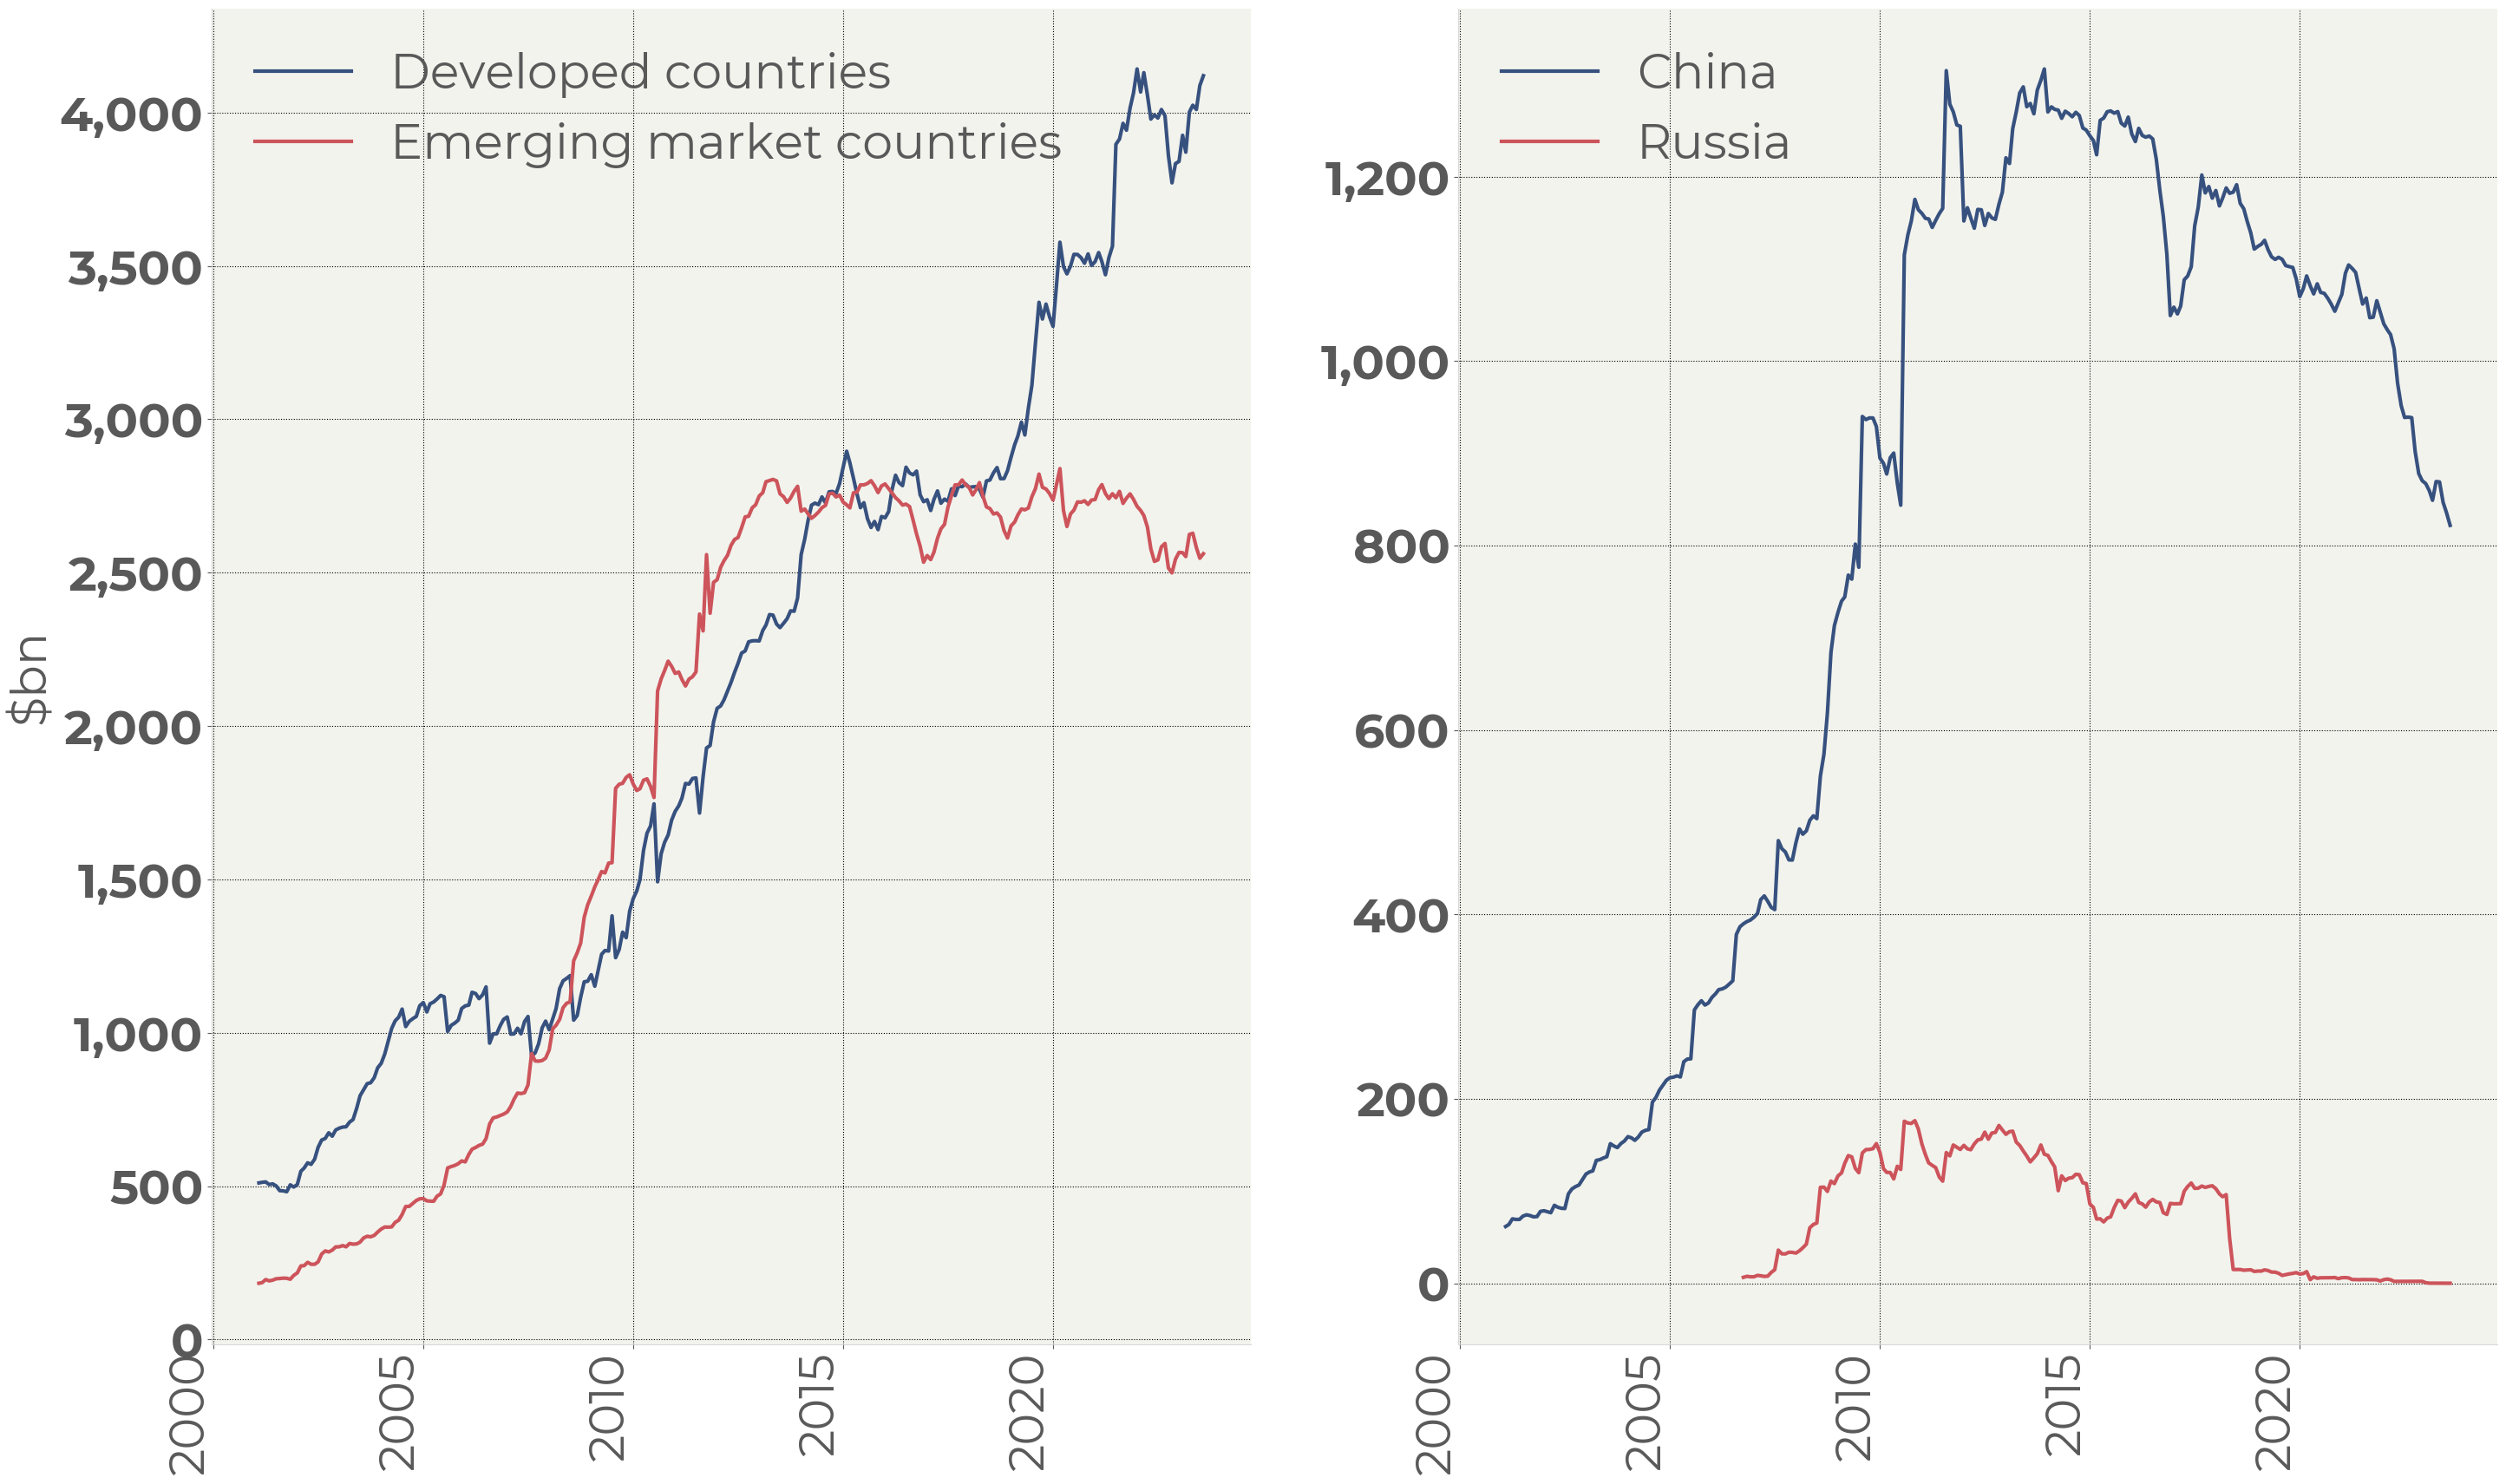
Figure 12. Major foreign holders of US debt
Around 2013, though, emerging markets lost their attractiveness for foreign investors. Moreover, the US started using the FX reserves as a financial weapon threatening to freeze FX reserves in conflicting situations.
That forced Russia to get rid of its stock of US bonds in 2018. China also accelerated reducing its bond portfolio amidst the sanctions against Russia and a possible conflict with Taiwan (Figure 12, b).
The threat coming from the portfolio reduction conducting by the major US debt holders – the Federal Reserve and China – cannot be ignored by investors.
Nevertheless, the bond sale by China is compensated by other Emerging market countries. The investments in US debt conducted by the developed market central banks, by contrast, is booming (Figure 12, a).
So, the total picture is not so grim.
Despite that, foreign US debt investments as a percentage of GDP has been falling since 2013 (Figure 13):
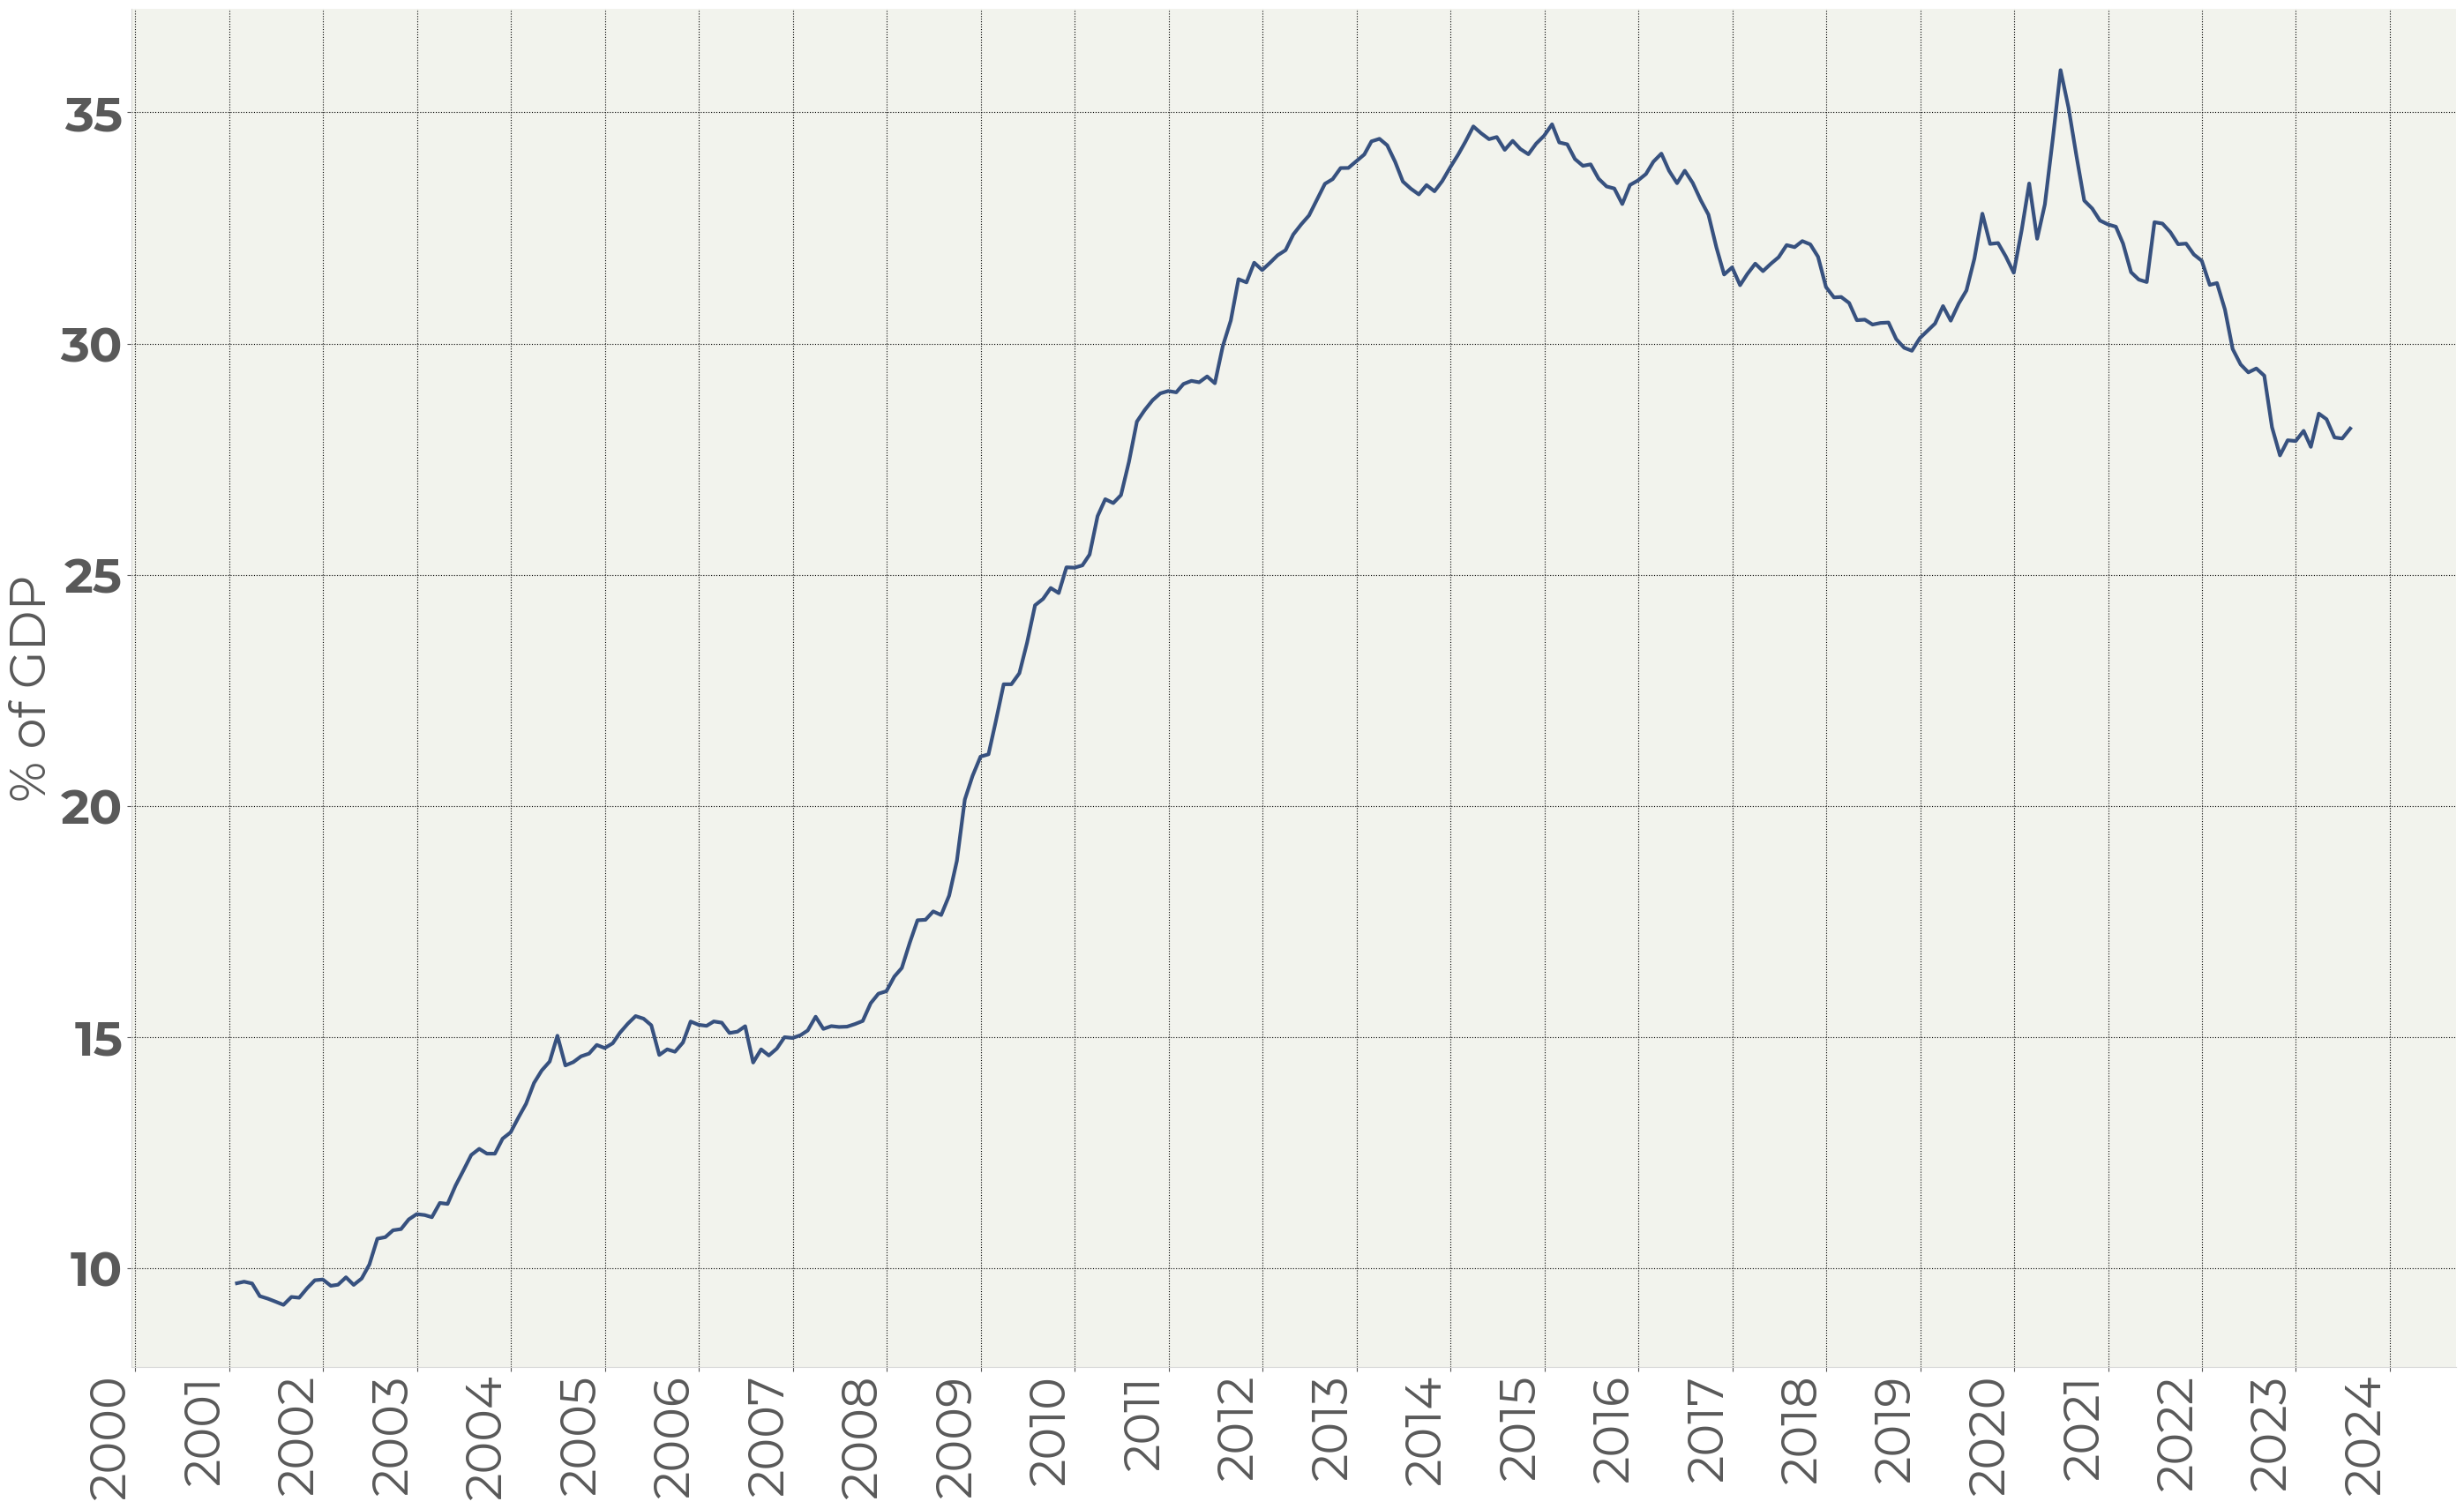
Figure 13. Total foreign holders as per cent of US GDP
We should acknowledge that foreign central banks are no longer a good support for the US treasury market. Along with that it is worth noting that this trend is not new. It also existed in 2013—2019 period when the US bond market remained in its long-term uptrend.
Technical view on the US Treasury bonds
We cannot deny the influence of the Federal reserve policy on the bond market. The scale of the market reaction, though, is unprecedented when it comes to the post-pandemic period. The rise of the debt burden by 30% after the GFC did not cause any reaction in the bond market (Figure 11, Figure 12). The surge in interest payments in 1985—1992 did not affect bonds negatively either (Figure 10).
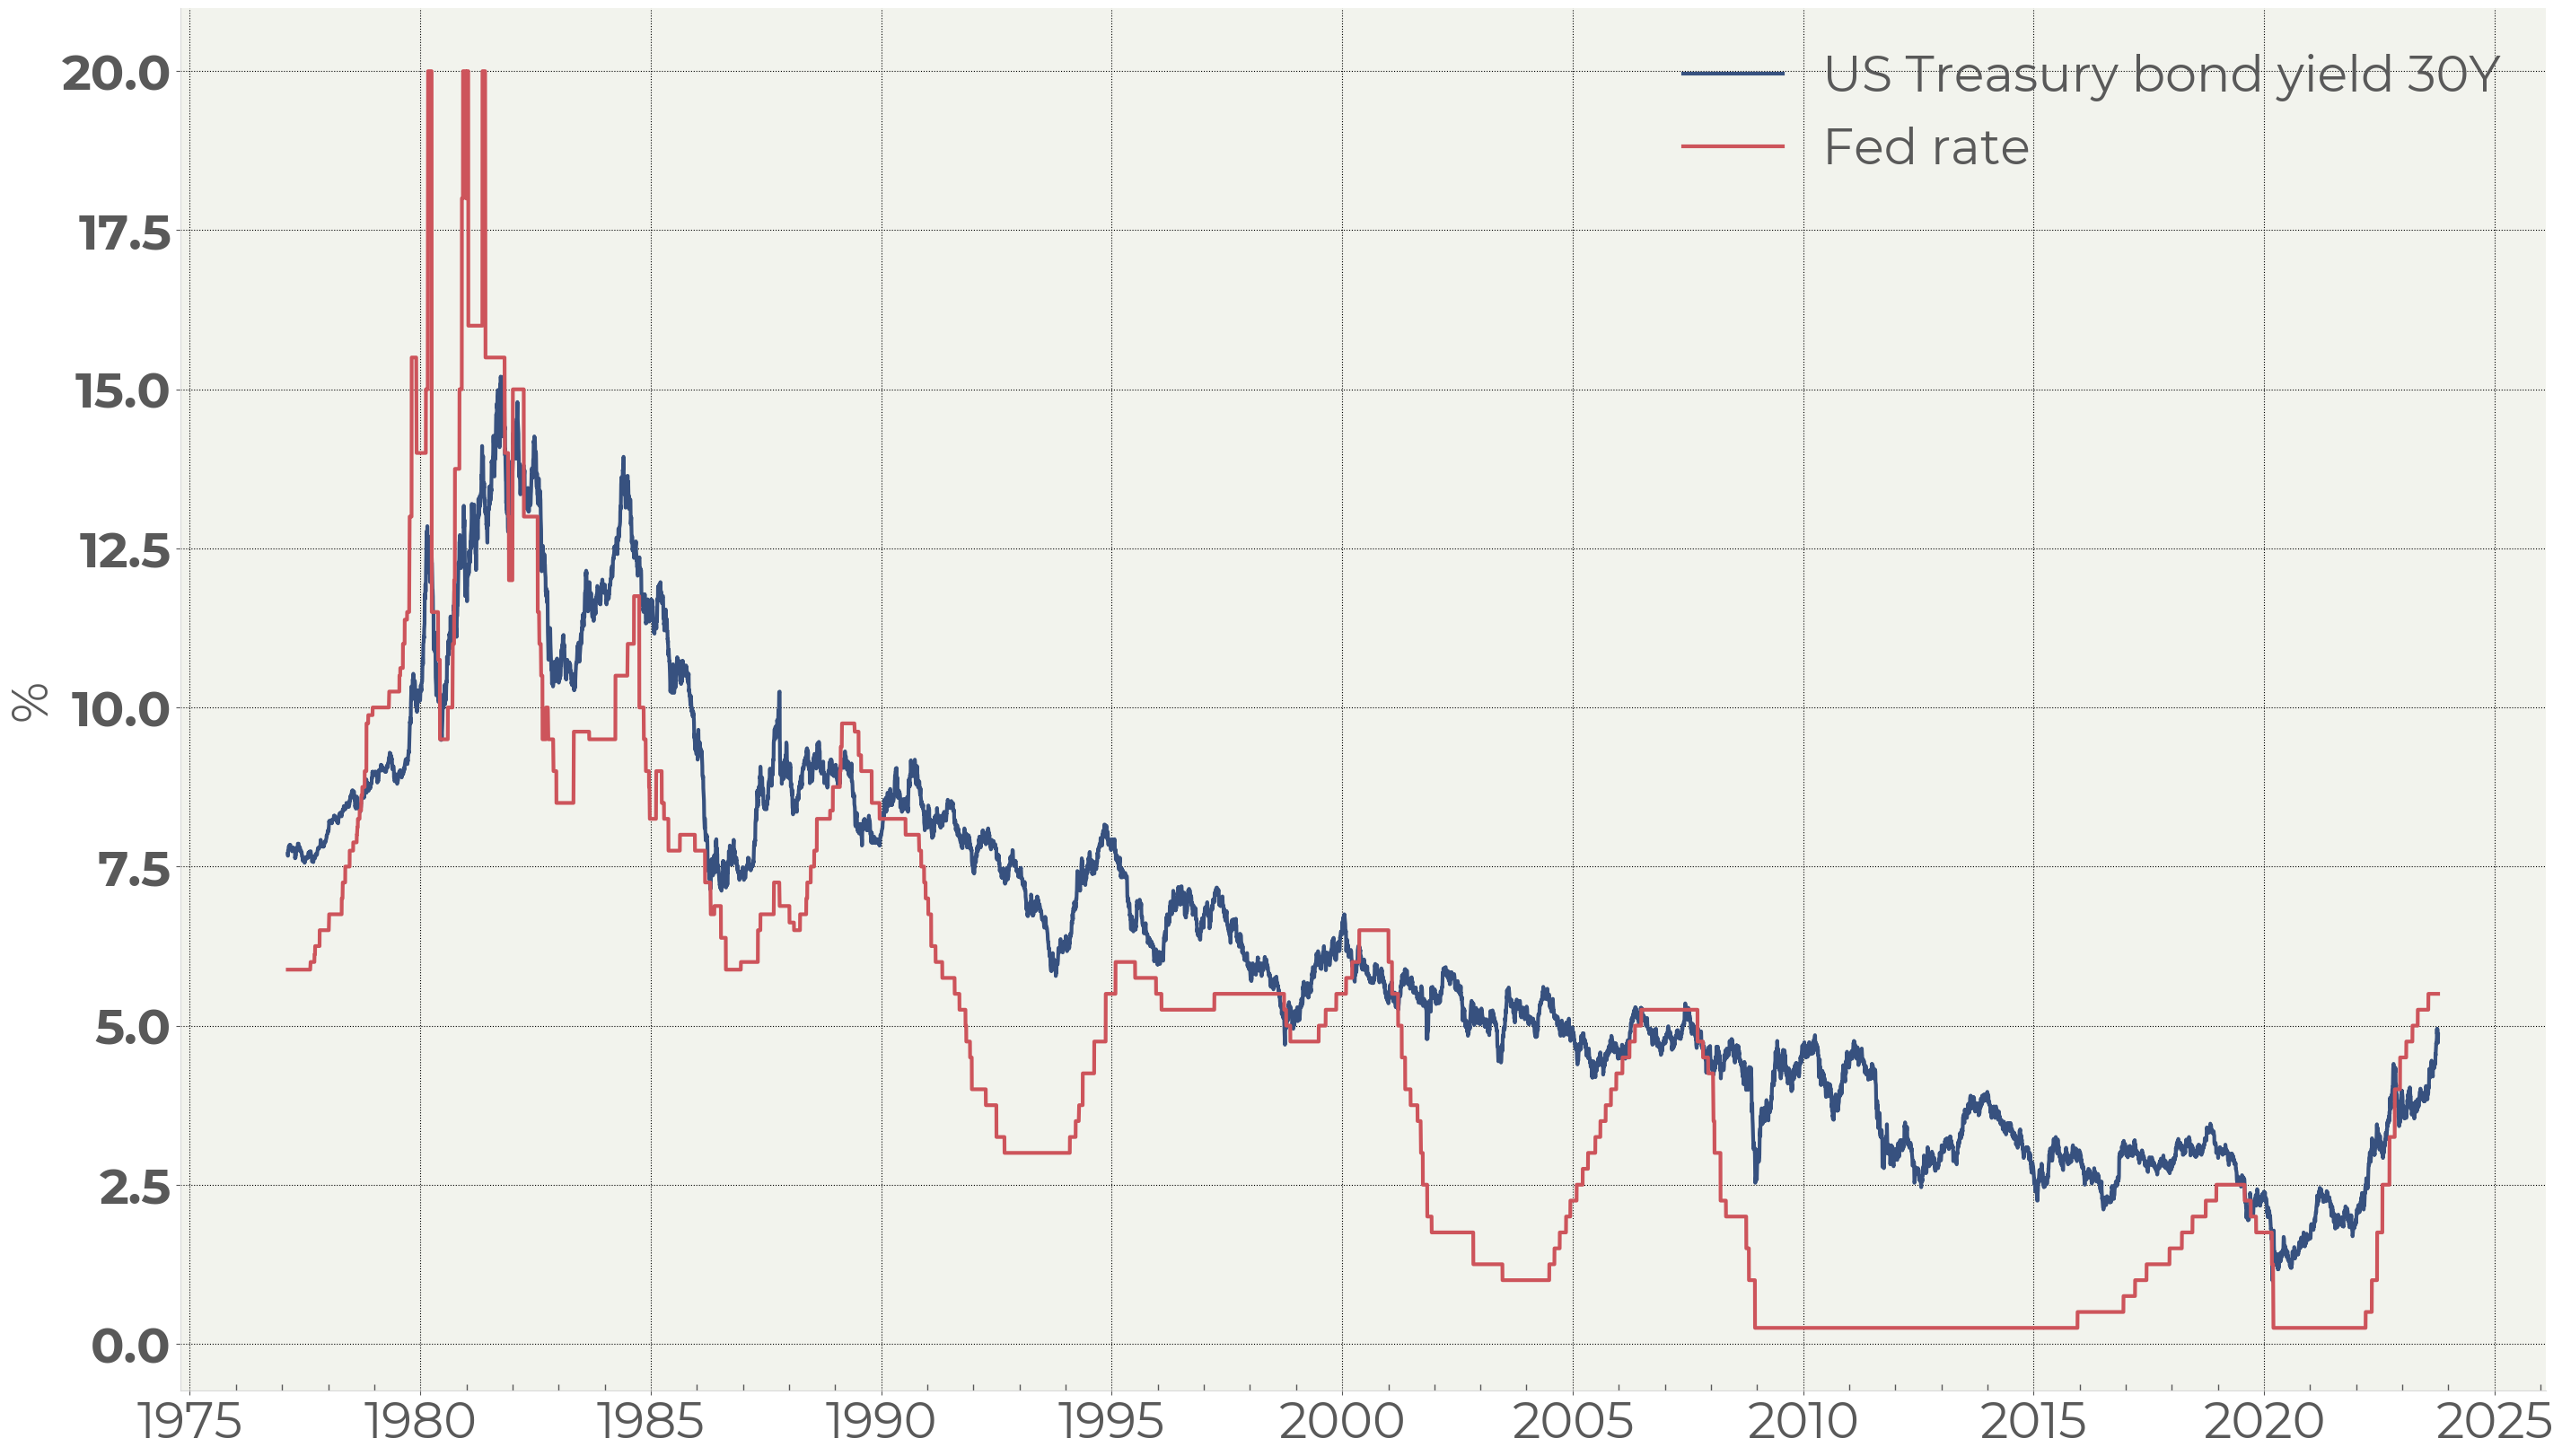
Figure 14. Long-term bond yields & Fed rate
In the previous cycles of tightening the maximum levels of the long bonds’ yield roughly corresponded to the Fed rate. From this perspective the bond market still has a downside of about 50bp, assuming that the rate hikes cycle is over.
It should be noted that there is no direct relation between the bond yields and the Fed rate near the top of tightening cycles. In Figure 12 we can see the examples that the bond yields were higher (1984, 1995, 2019) and the opposite ones (1980, 1989, 2001).
We also can see the cases where bonds started to recover along with the key rate (1984, 2007) and the cases where bonds went up ahead of the Fed (1989, 1995, 2000, 2019).
The comparison to the past patterns shows that that this time the bond market is reacting much more negatively and stronger than before. From a technical perspective the bonds fell out of the forty-year trend, so that the bond investors have found themselves in a new reality that has no parallels over the past fifty years. This makes investors weigh risks much more cautiously than ever.
Summary
Despite impressive swings in the US borrowings, the bond market supply-demand structure seems balanced. The oversupply of the federal debt meets the still existing US banks’ cash pile. In the long and of the curve the bond market is supported by the Federal Reserve: it has bought out more than $140bn of the long-term bonds over the past two years.
The assets of natural buyers of long-term debt have also increased. The government interest payments and the debt-to-GDP ratio, albeit increased, hardly have reached breakeven where the situation becomes dangerous. The swap and equity markets do not reveal the signs of upcoming issues with the credit quality of the country.
Along with that one cannot ignore the significant change of the situation both from a fundamental and a technical perspective. It creates risks by itself and averts investors from bets in the bond market until the situation becomes clearer.
It seems that the most important driver for this market is the Fed’s policy that can change either if inflation returns to its norm or in case of a significant worsening in the economy.
© 2022. All Rights Reserved
All content of this site is for informational purposes only and is intended for qualified investors. Information provided on this site is not a promotion or advertisement of securities and/or investments, is not an offer to sell or solicitation of an offer to buy any securities, funds, investment instruments, products or strategies, and should not be considered an individual investment advice or recommendation. Financial instruments mentioned on this website may not be suitable for your investment profile, experience, investment goals, risk and return objectives. Before making an investment decision, investor needs to independently evaluate the economic risks and benefits of such investments, tax and legal consequences of investing, his/her willingness and ability to accept such risks, or consult with his/her investment adviser. Movchan’s Group companies and employees are not investment advisers and are not responsible for possible losses of the investor in case of investing in the financial instruments mentioned on this website. Information provided on this site does not guarantee or promise any future investment returns. Past investment returns do not guarantee or promise any future investment returns.