The US statistics that came in in July-August 2023 are revealing resistivity if the US economy to the high-rate environment. The real GDP, as of June 2023, is 7.6% higher than in June 2019. The Atlanta Fed GDP nowcasting is showing 5.8% of projected growth for Q3. Part of this growth is a result of low rates in 2021-2022 when the US fixed investments were at their highest level over the past 15 years. In this review we are investigating another phenomenon – a shift in Retail Sales cycles and its influence on GDP growth.
Retail Sales
The total retail sales gauge for July published on 15th of August was up 0.7% MoM versus expectations of up 0.4%.
The monthly changes of Retail Sales (Figure 1) are volatile and, strictly speaking, one monthly reading says a little. The expectations were based on the average value of the seasonally adjusted data. Given its fluctuations, an error of 0.2% is acceptable:
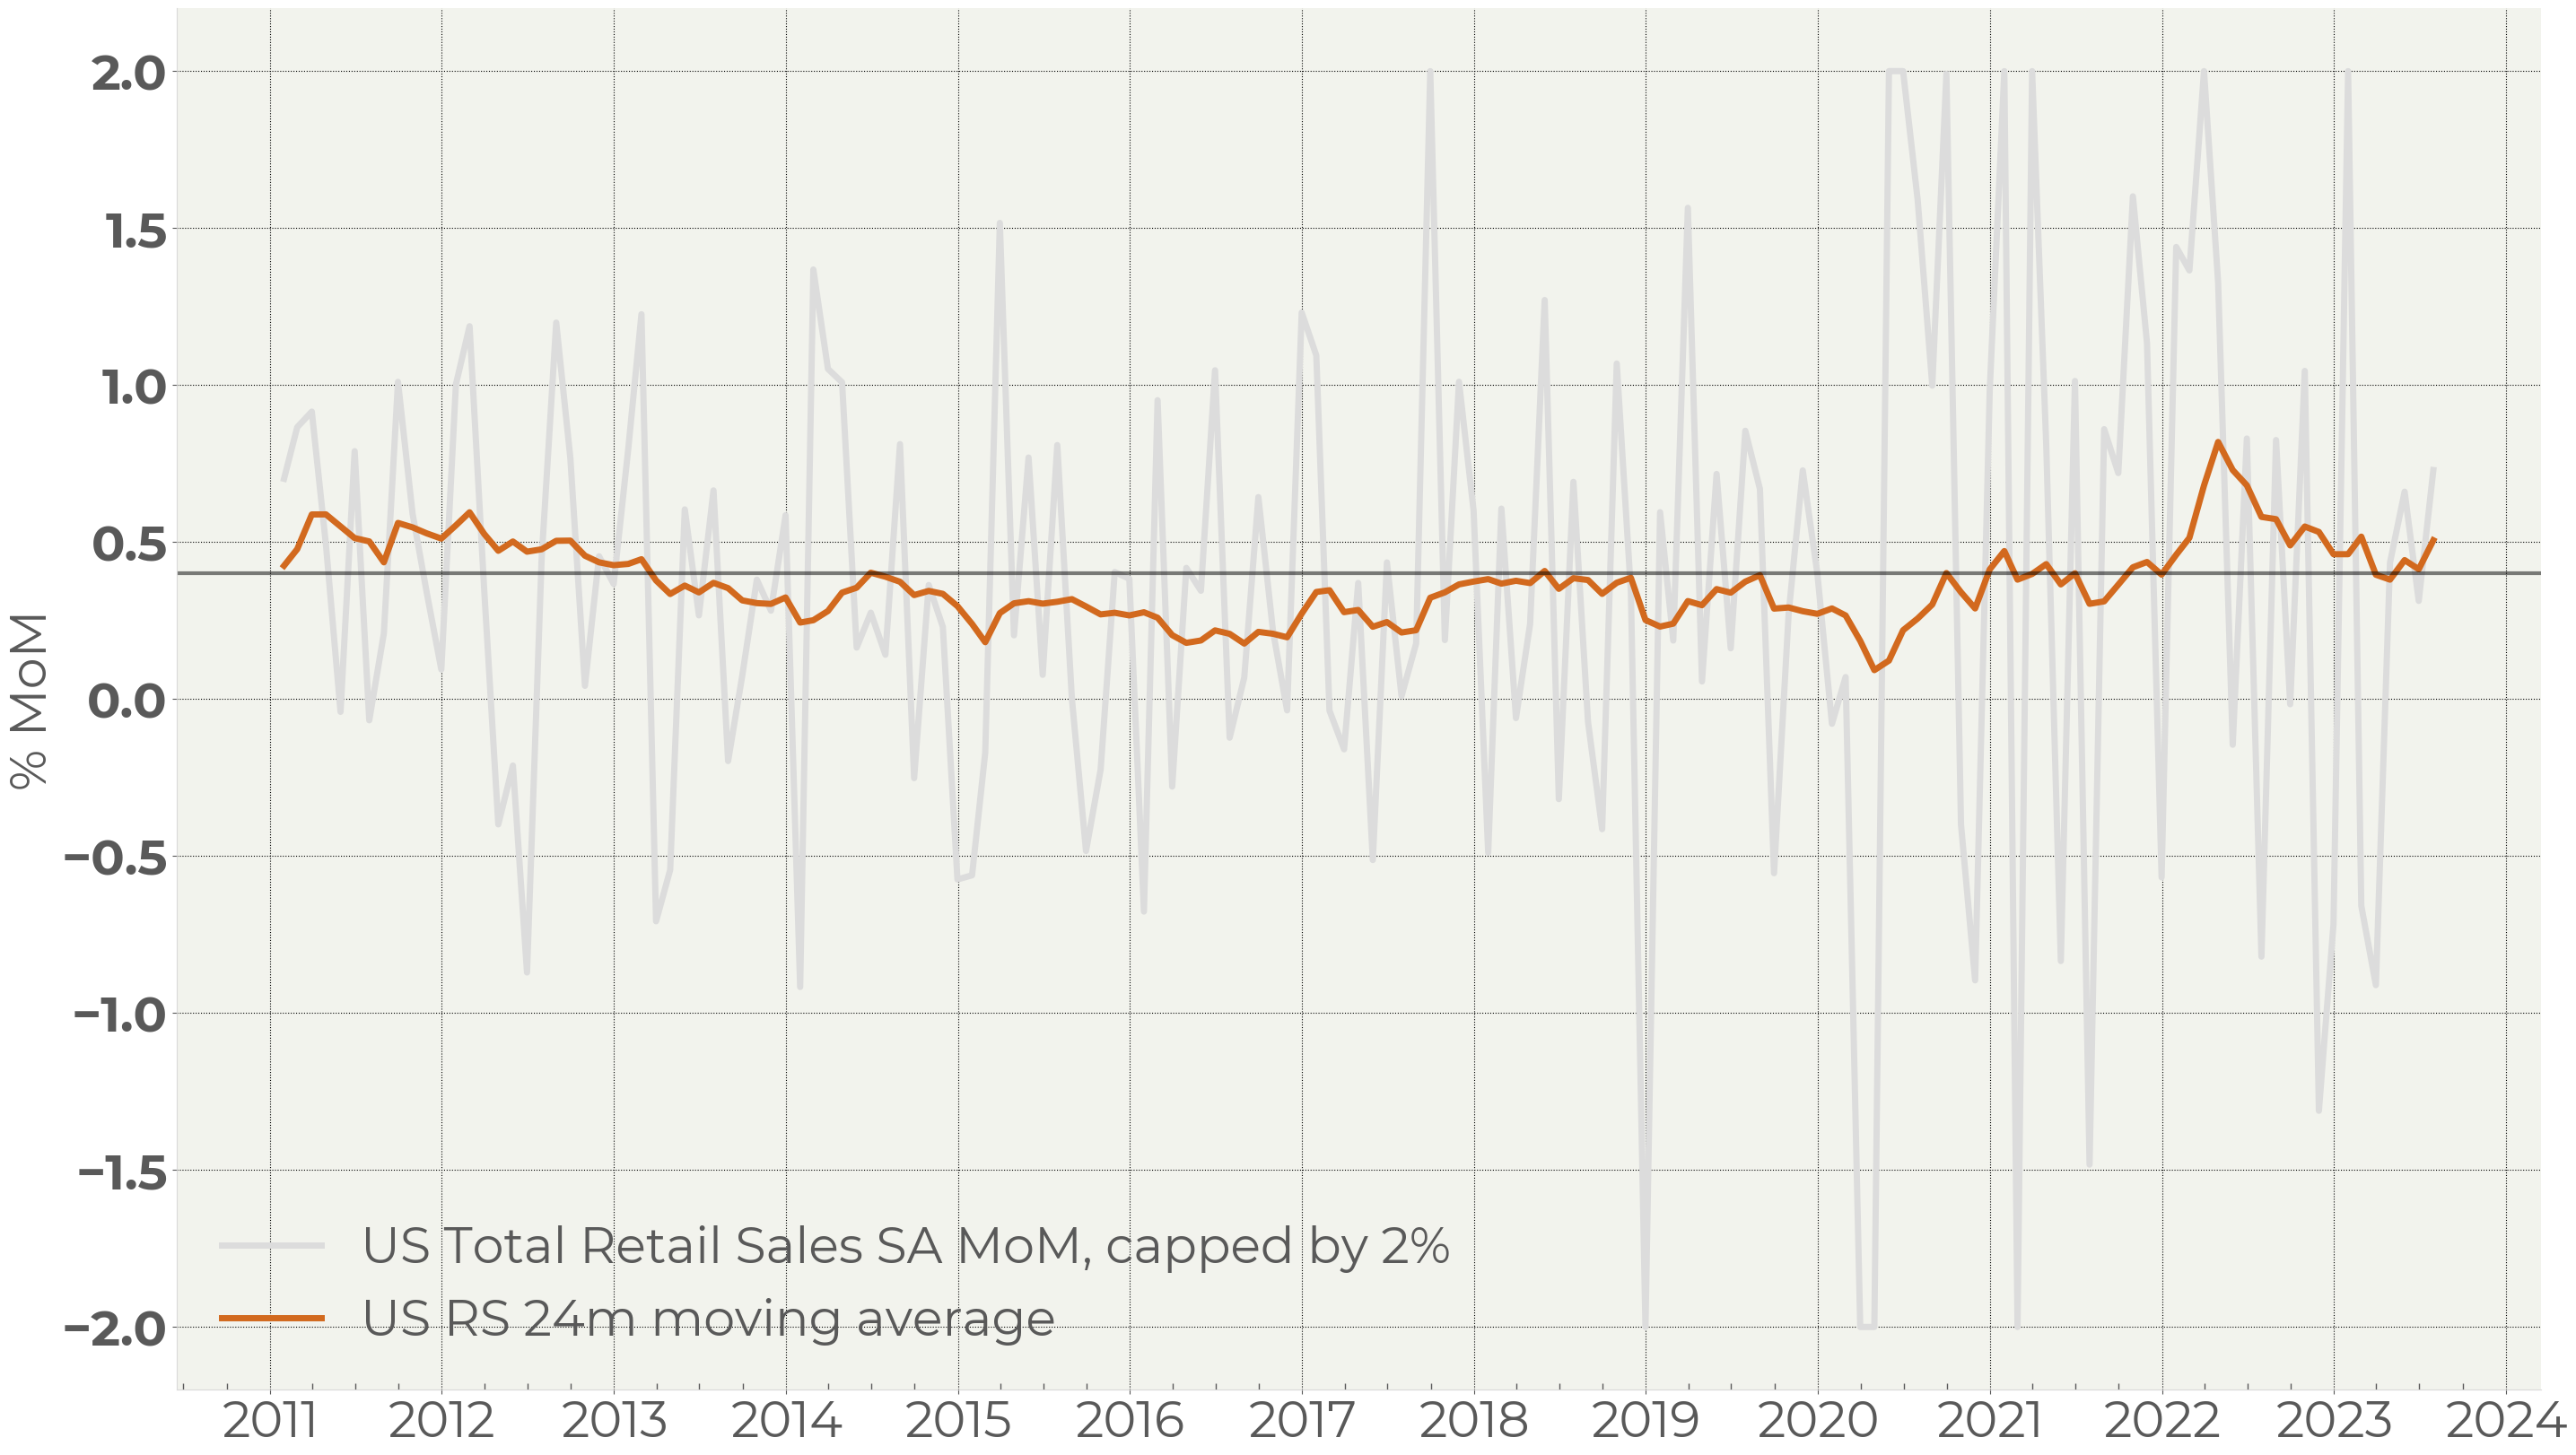
Figure 1 . US Total Retail Sales SA MoM, capped by 2%
In the current situation the unadjusted figures are more interesting.
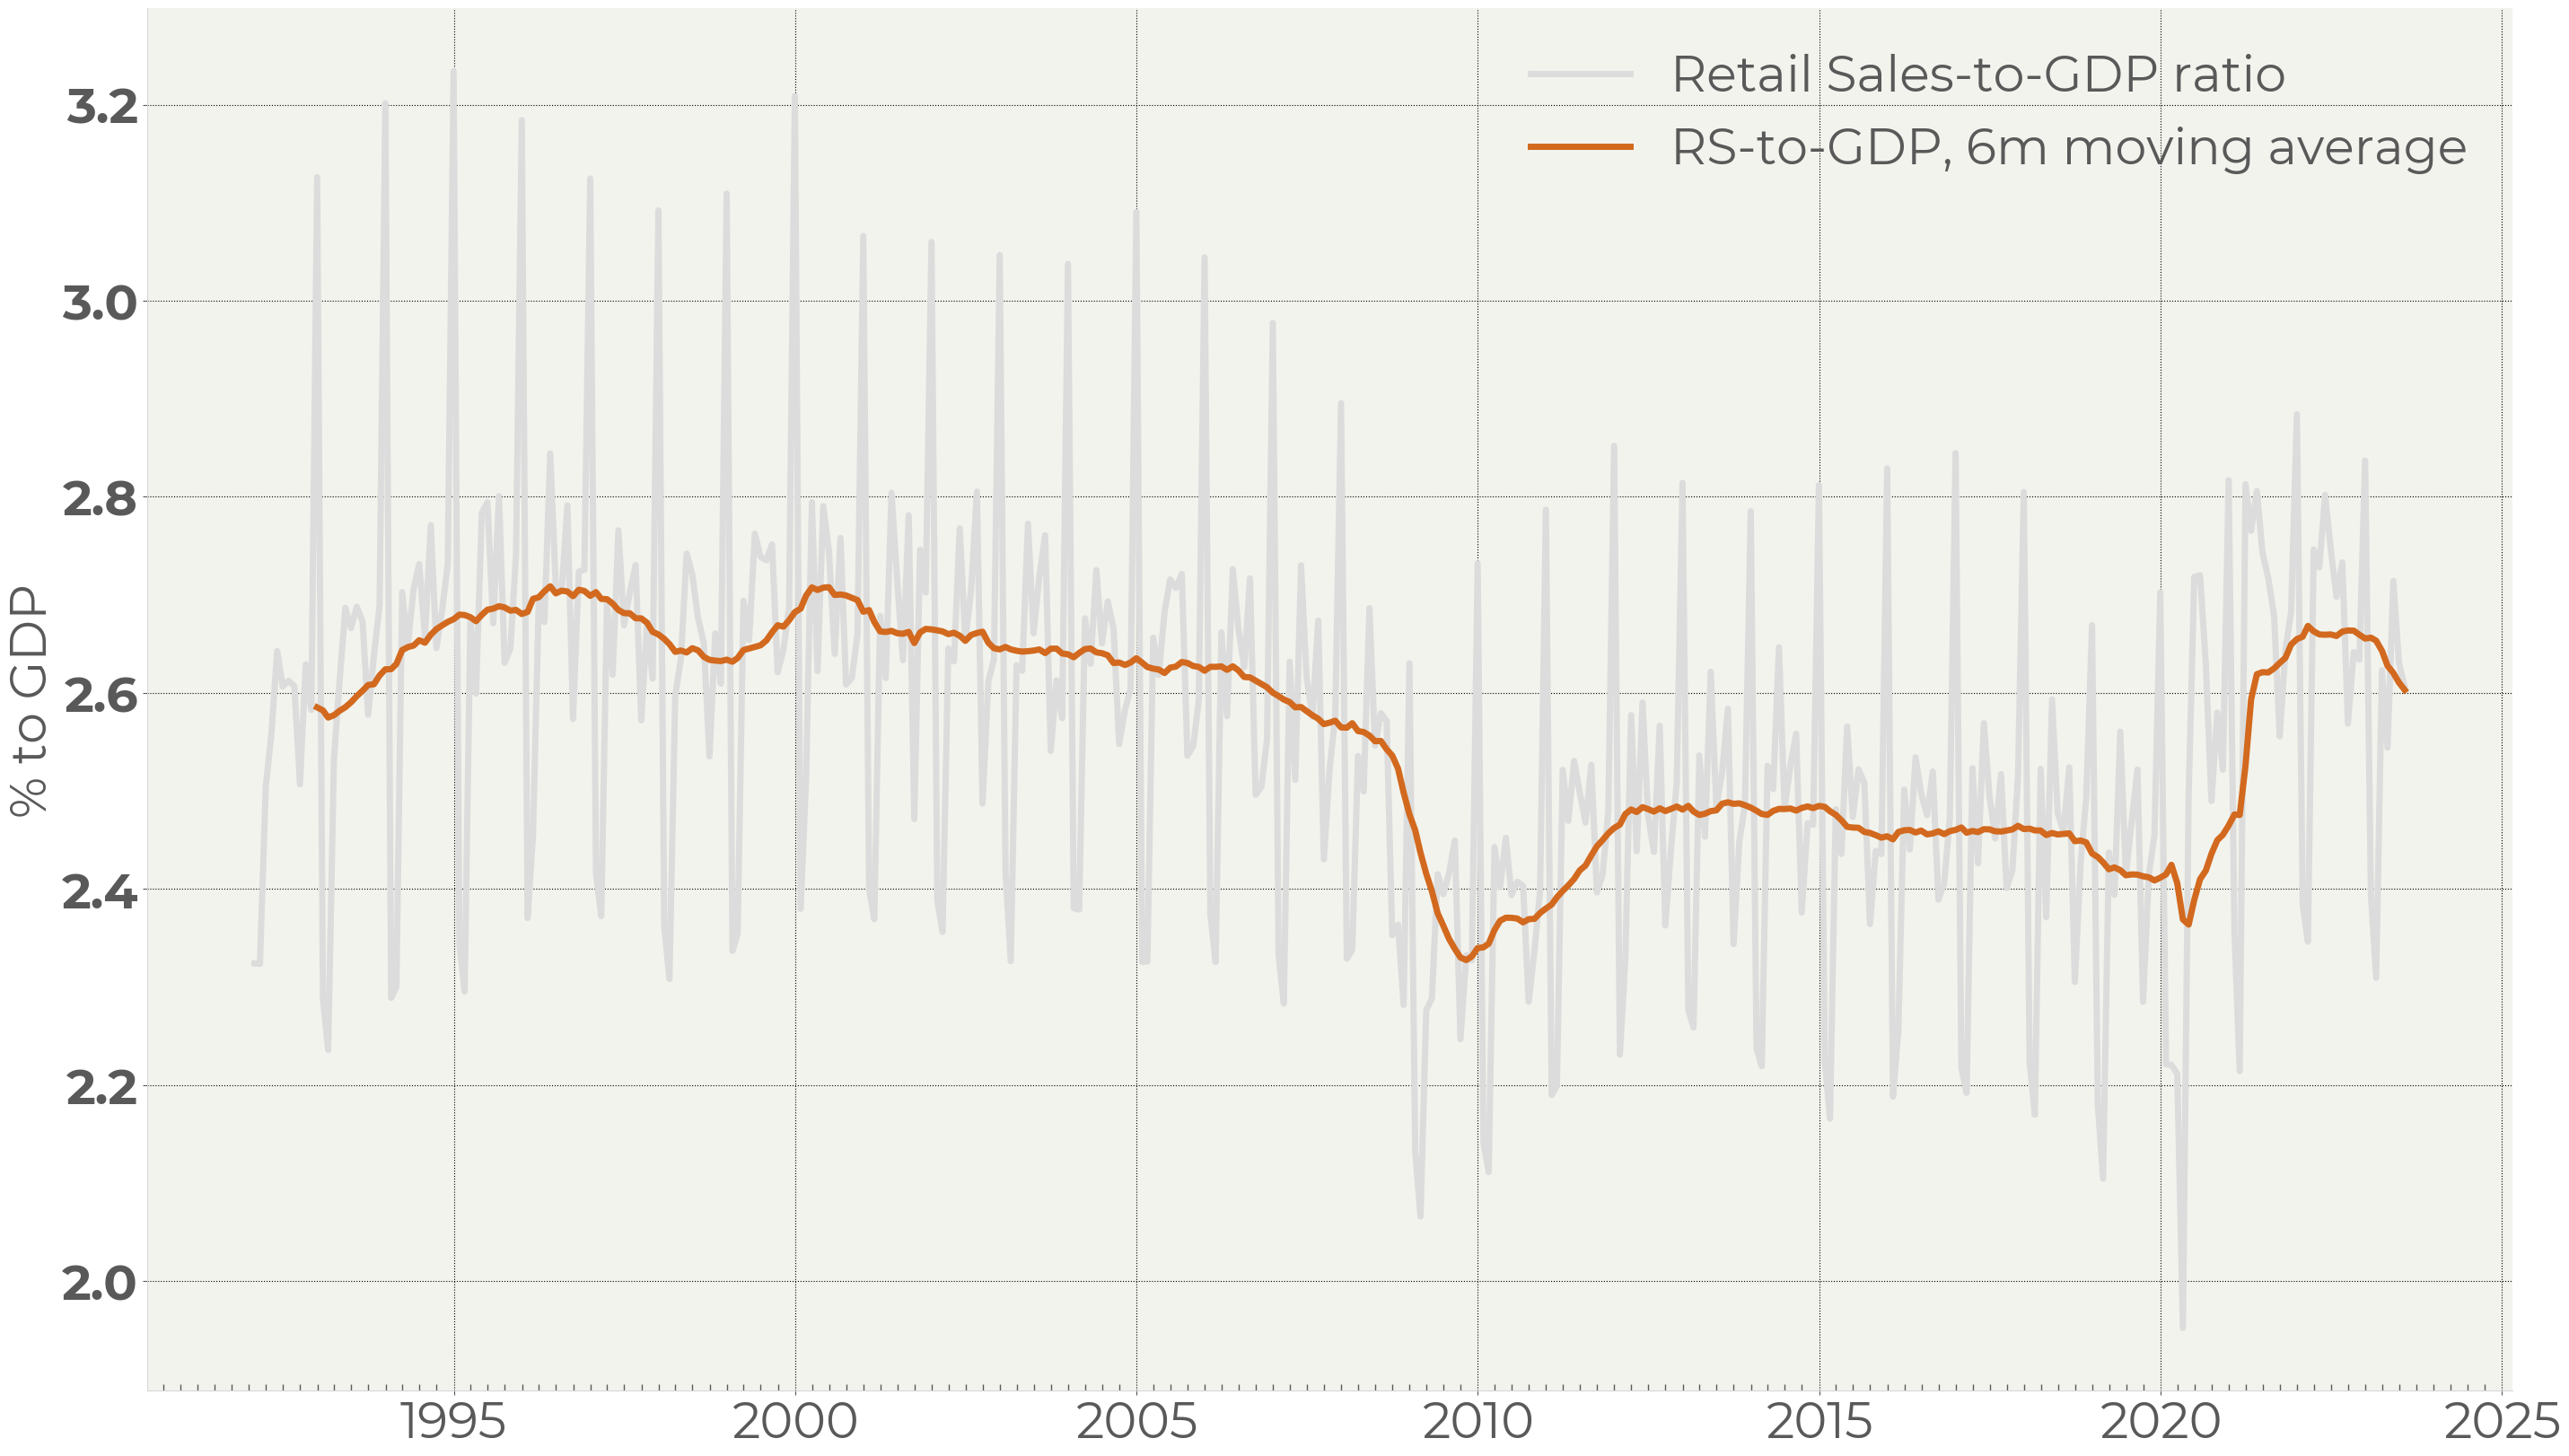
Figure 2 . The US Retail Sales-to-GDP ratio
The retails sales have a strong seasonality within a year. The most active months are December and May, the least active are January and September. In terms of percentage of GDP, retail activity remains at the same level in December. The top of the range is limited, therefore, by economic capacity. The extra demand that cannot be met by supply of services and goods redistributed onto less active months (Figure 2). This shifts the bottom of the range higher and leads to larger economic capacity utilization1 .
This effect provides extra 0.2% of monthly demand on average as the moving average in Figure 2 witnesses. This gives us 2.4% of annual GDP growth which can be attributed to the retail sales “redistribution” effect.
In our view, it is more important that the RS/GDP ratio started weakening. We are expecting a return to normal retail sales seasonality distribution within a year.
Being put into this context, the July figure corresponds to this trend.
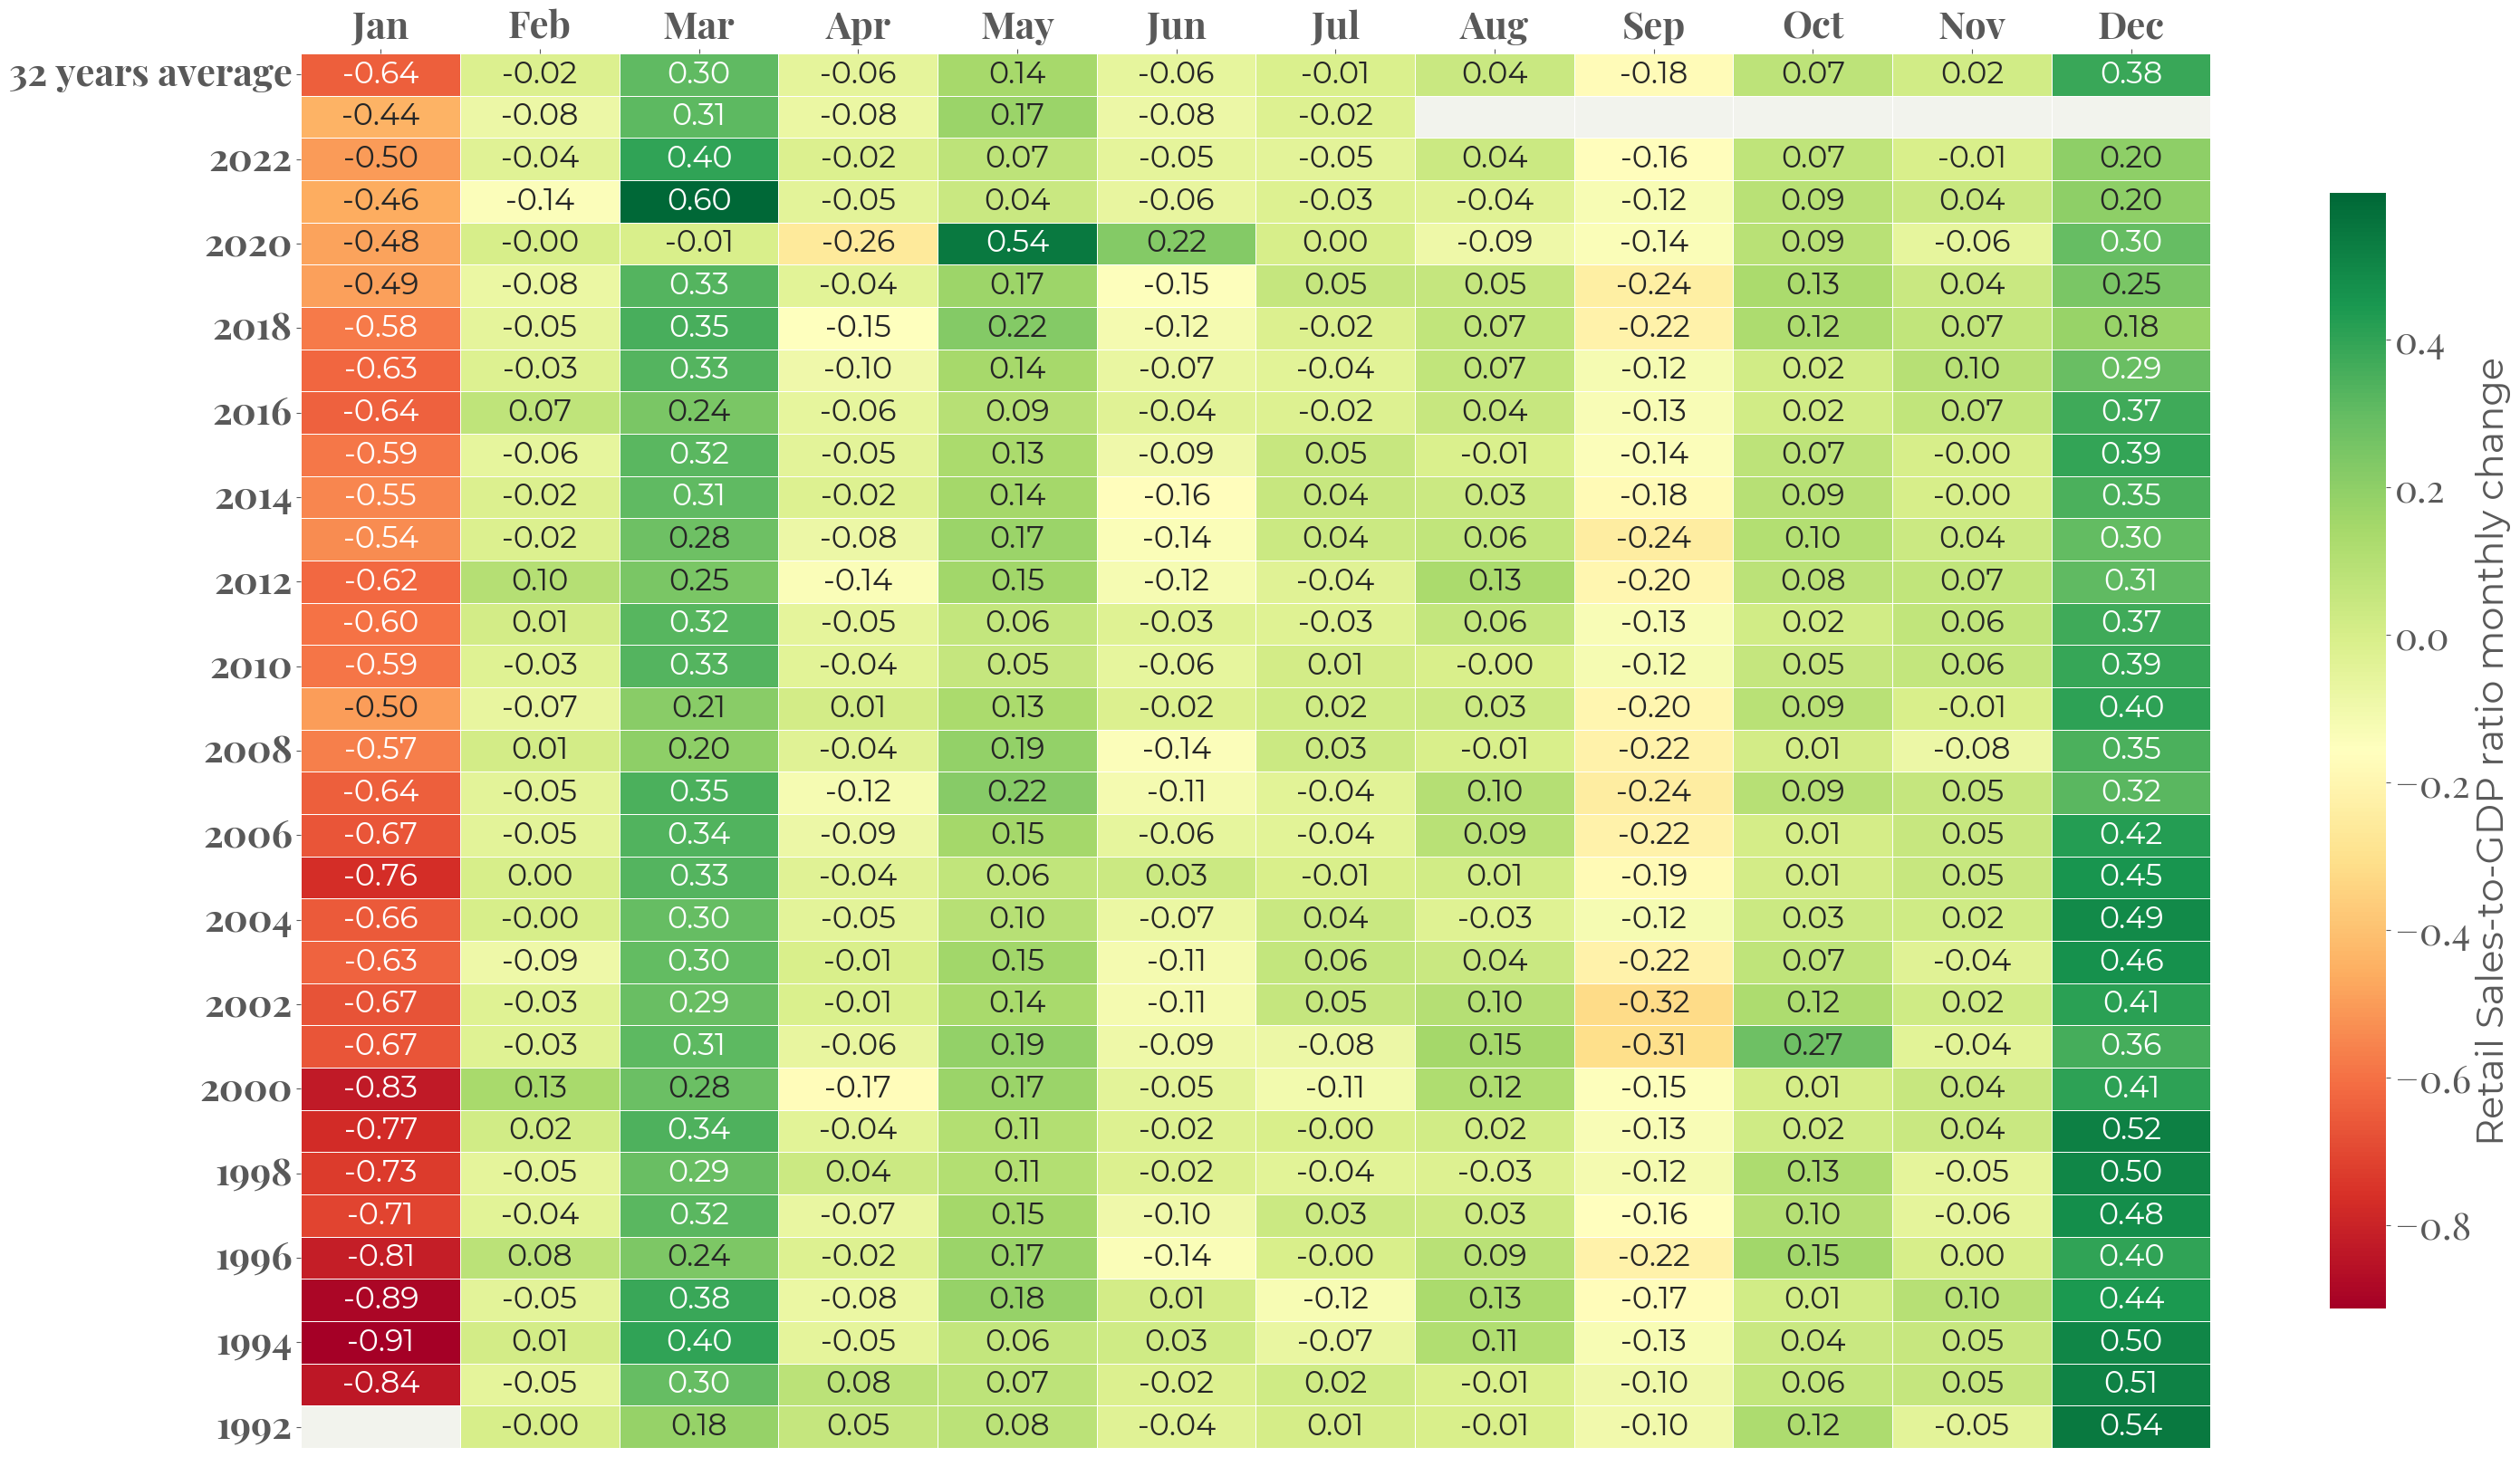
Figure 3 . Retail Sales-to-GDP ratio seasonal heatmap (unadjusted figure)
The heatmap on Figure 3 displays the seasonality of retail sales share in GDP. The July reading -0.02 is below the average over the past 32 years – since the inception of the retail sales statistics.
Figure 4, showing a monthly seasonality, highlights the difference in consumers’ behavior before and after the pandemic.
The post-pandemic inflated demand pushed summer activity closer to what we can observe in the Christmas period:
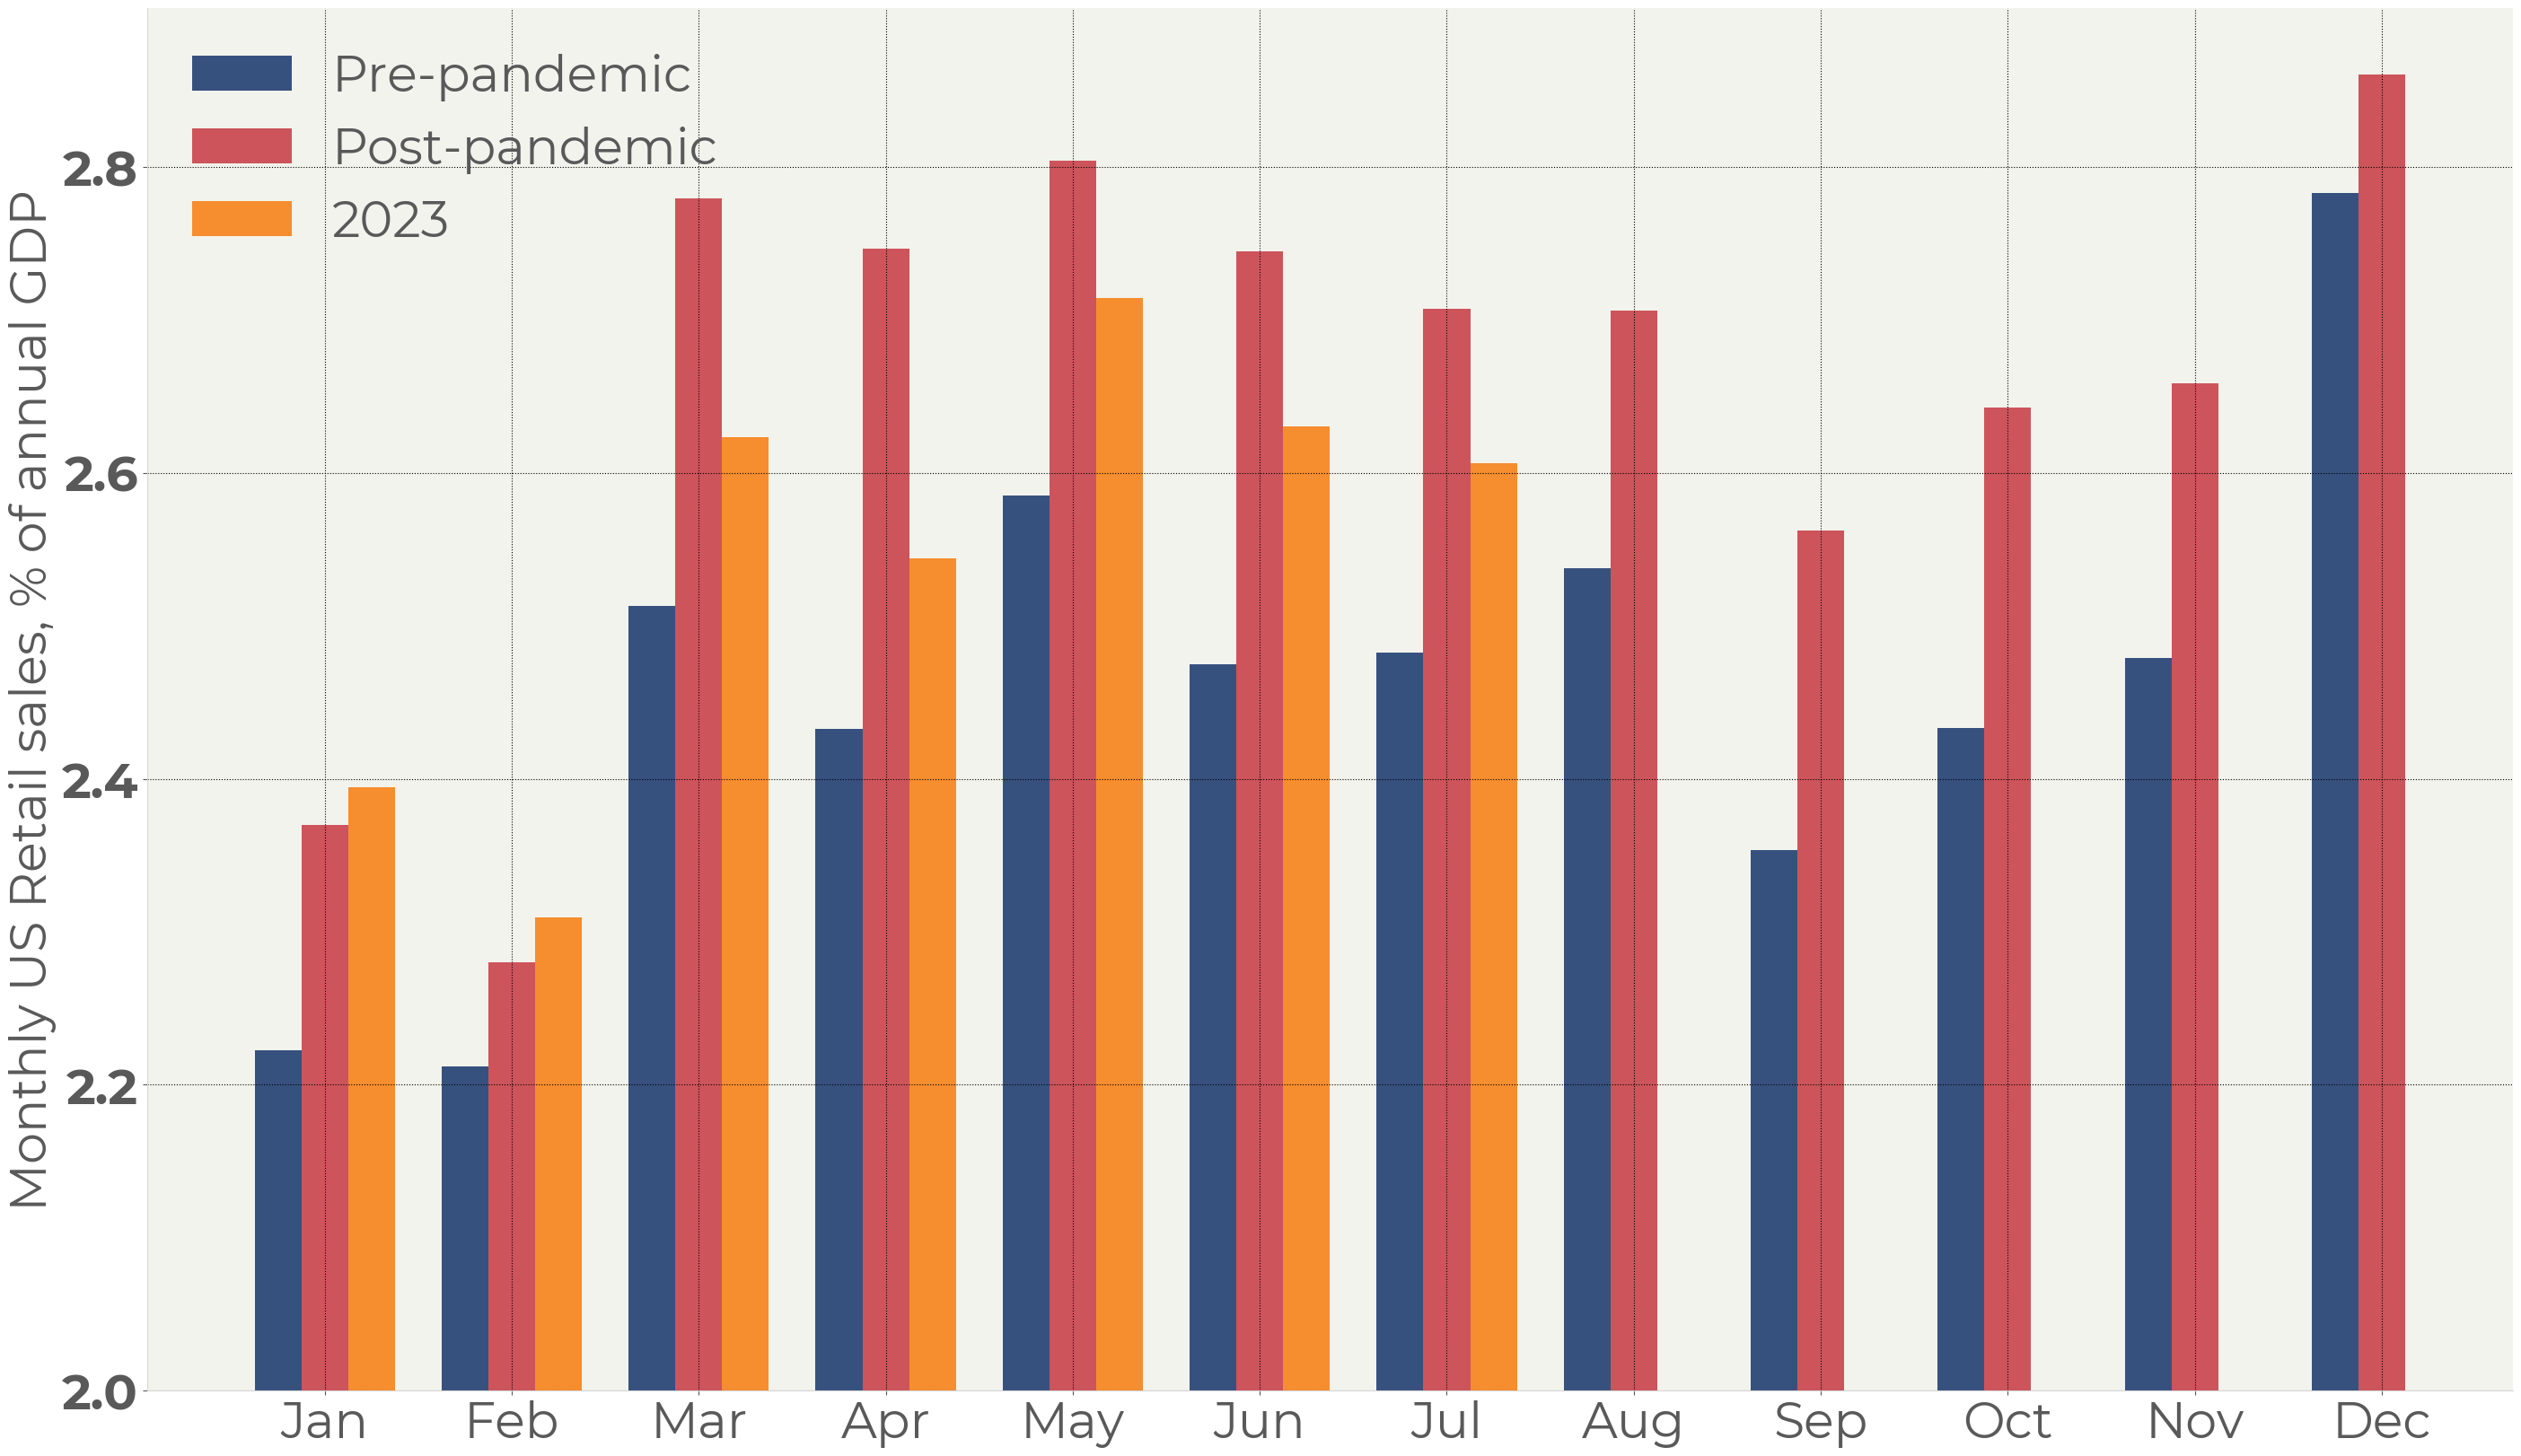
Figure 4 . Retail Sales-to-GDP average for pre-pandemic period (2012-2019), pandemic period (2020-2022) and for 2023
2023 retail turnover is significantly weaker than it was in 2021 and 2022. This reflects easing in the labor market, monetary excess, and inflation: all those figures are halfway through returning to the pre-pandemic normality.
Investors should keep in mind that this normalization will get the economic capacity utilization back which will subtract more than 2% of US GDP in the nearest future.
Summary
The monetary excess leads to enhanced consumers’ activity and influences, above all, seasonally weak months resulting in redistribution of monthly retail turnover. This helps the economy provide an extra ~2.4% of annual GDP without the expansion of its capacity.
However, retail activity is cooling down. The July data does not provide any grounds for the opposite point of view. On the one hand, we have normalization of the overheated economy. On the other hand, it is producing the downside risk for GDP growth ahead.
1 . The term “capacity” is used here in a broader sense than a classical definition only taking manufacturing facilities.