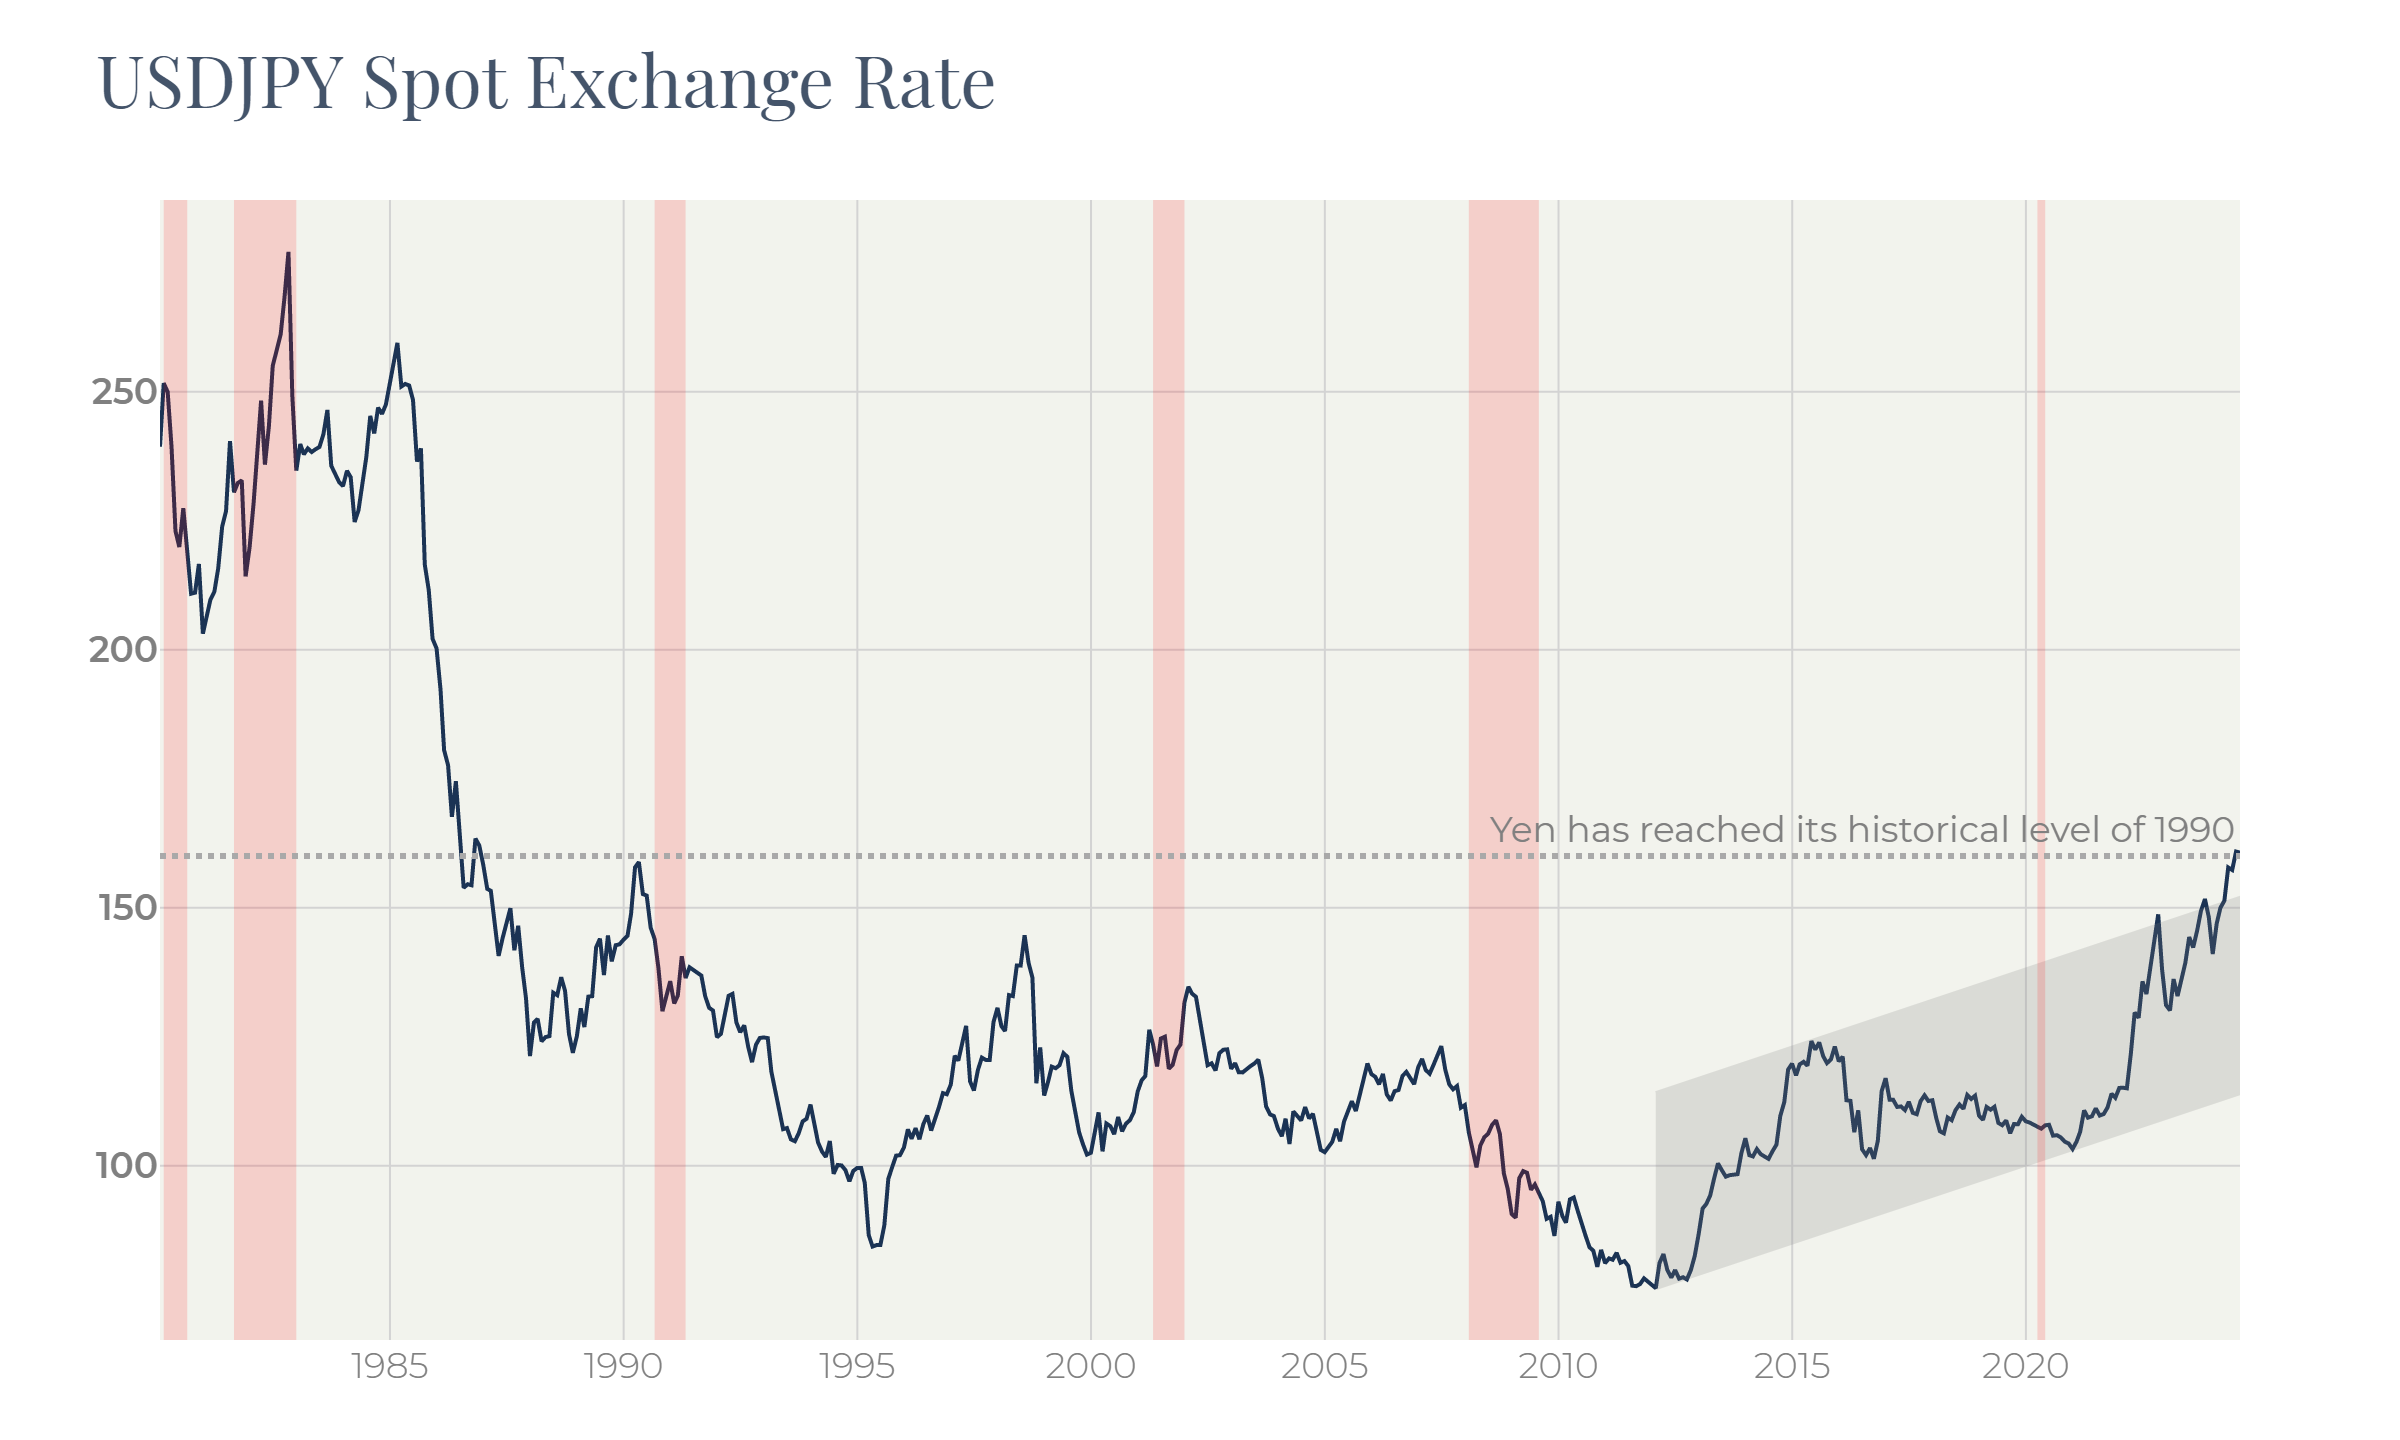
Since the start of 2022 the Japanese yen has devalued more than 50%. On July 25th the yen’s rate broke its historical high that was touched once in 1990 and went into the territory where it used to be in 1986—1990. The BOJ intervention made in late April only helped for a week. Beginning in May, the yen continued its gradual weakening. The question is how far the yen can weaken.
Trade balance and the current account
Figure 1
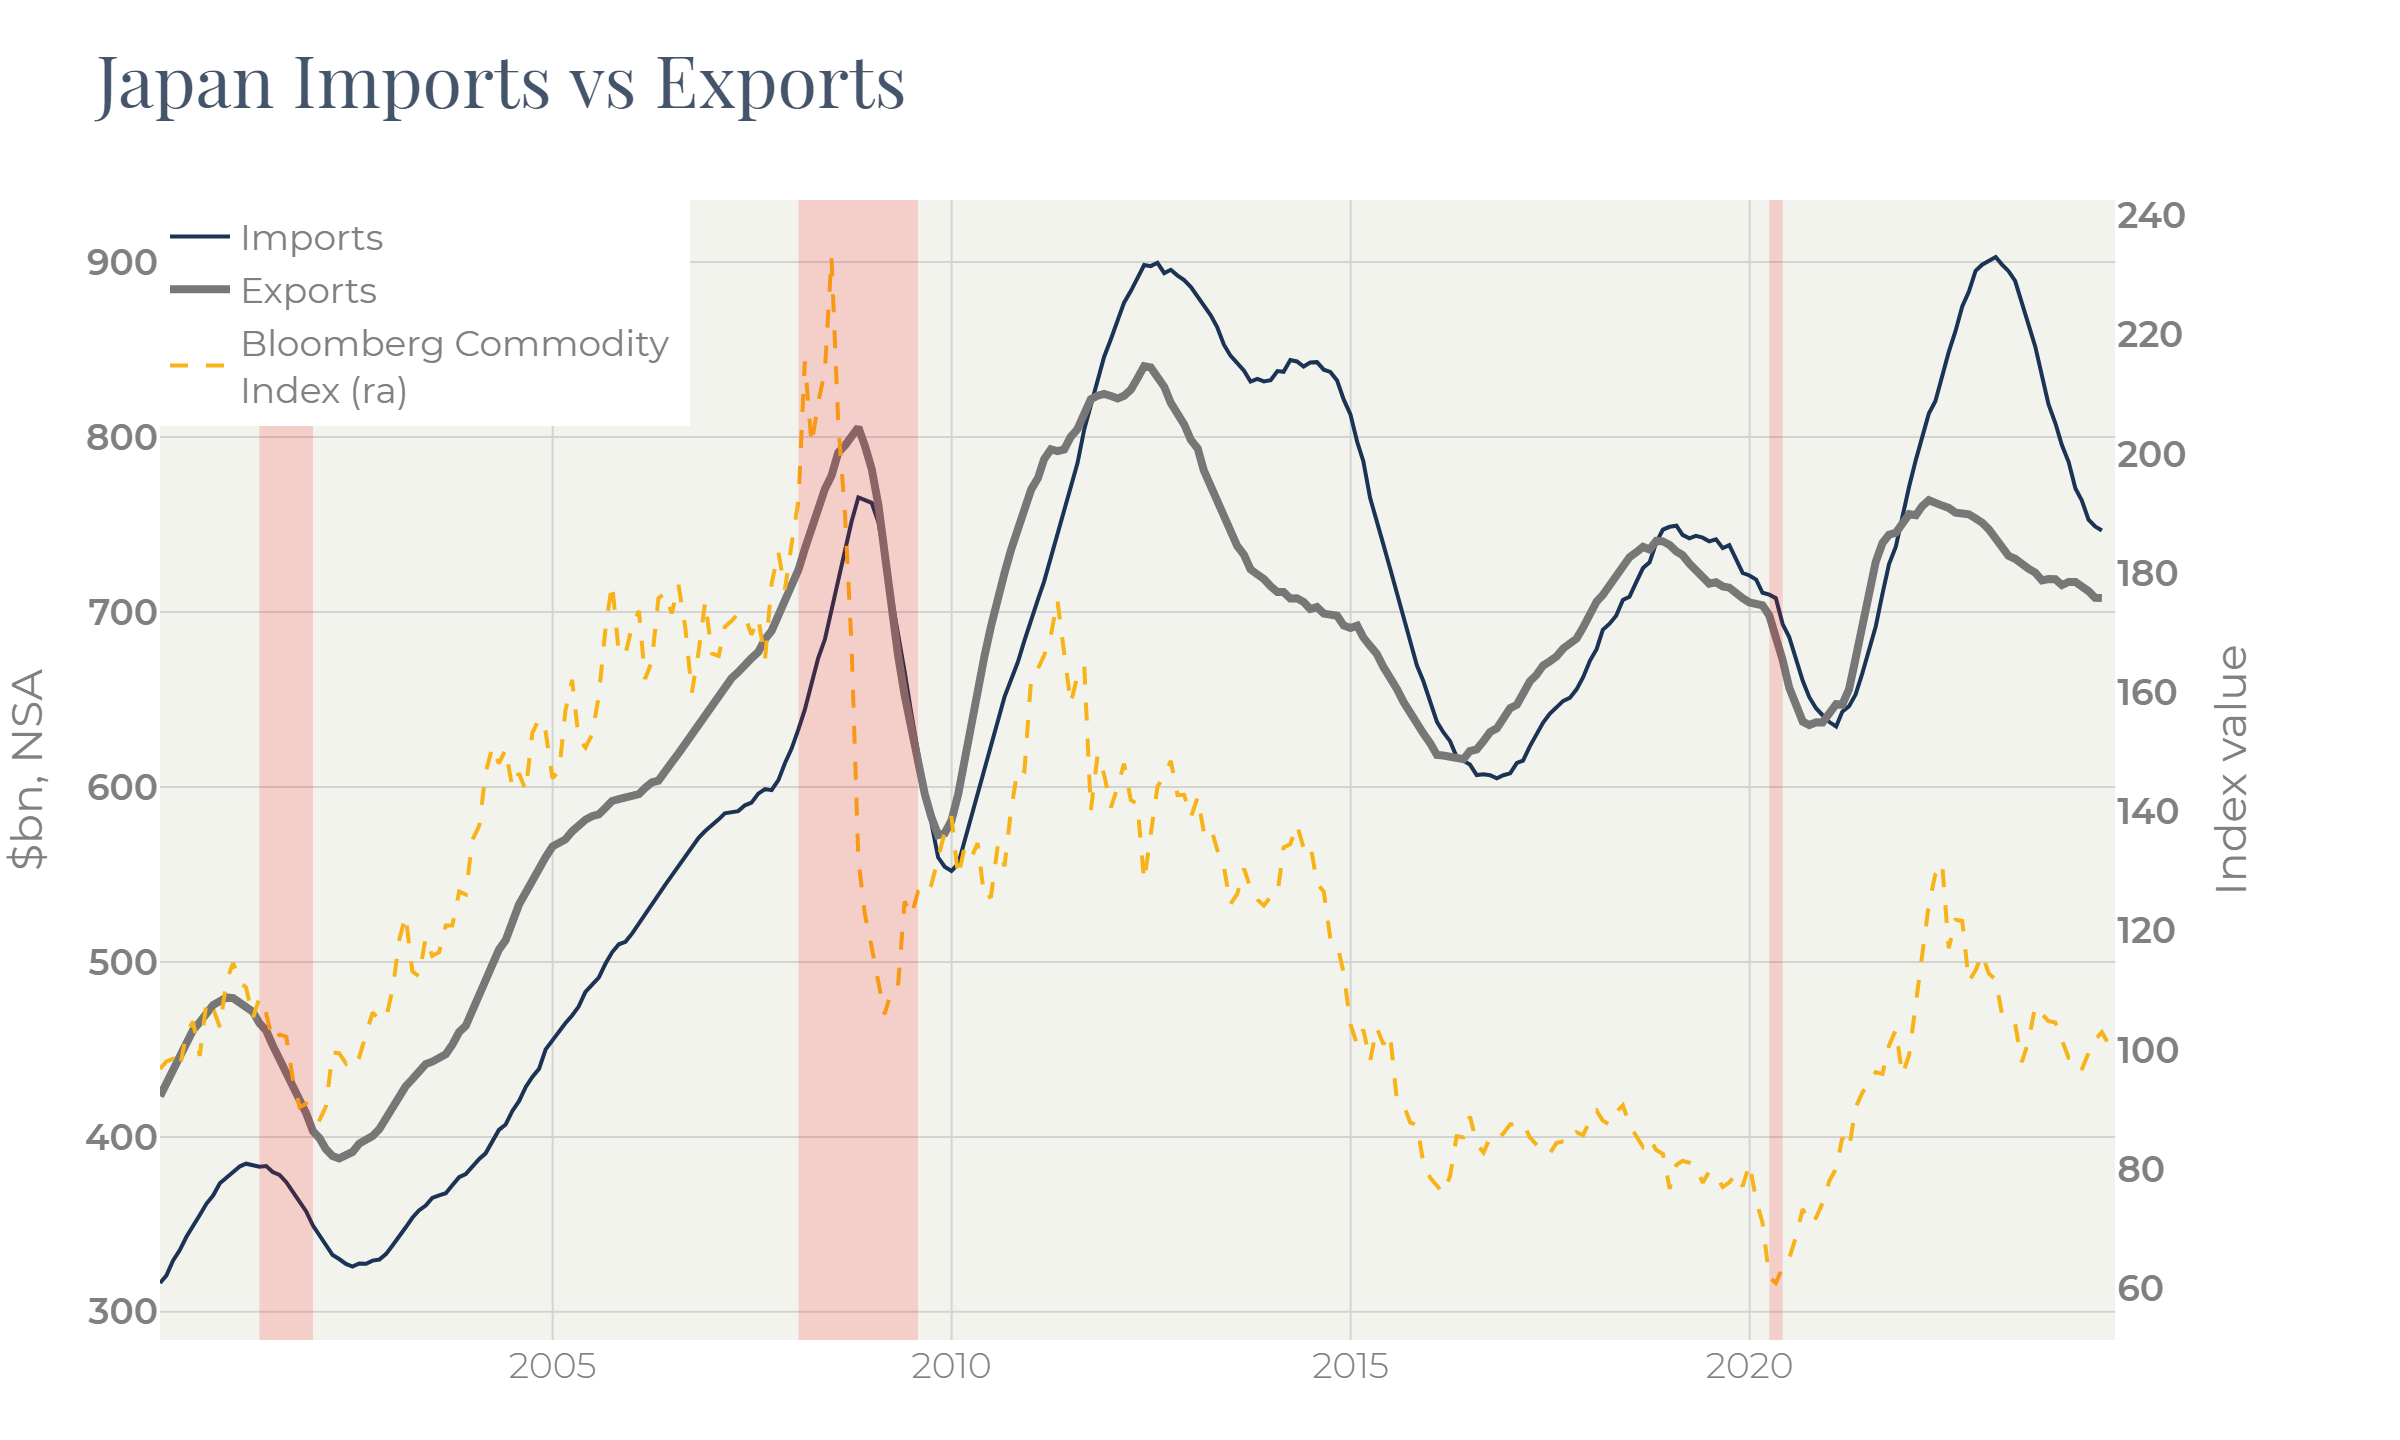
The first thing coming to mind is that the 50% currency devaluation should dramatically improve the country’s trade balance. Figure 2, though, gives a much more discreet picture: after the pandemic began the Japanese import surged while the export only increased moderately. The national currency devaluation only fractionally improved the situation, leaving the trade balance in the negative zone. According to the same chart, the deterioration of the trade balance in Japan often corresponds to spikes in commodity prices.
Figure 2
Heavy dependance of the trade balance on the currency rate is typical to countries exporting commodities. In their case, almost 100% of exported goods are locally produced, so that the costs of such goods are almost completely nominated in local currencies.
Japan, by contrast, heavily relies on import even for producing the exported goods. Only a fraction of the cost of exported goods represents added value in the local currency.
Figure 3
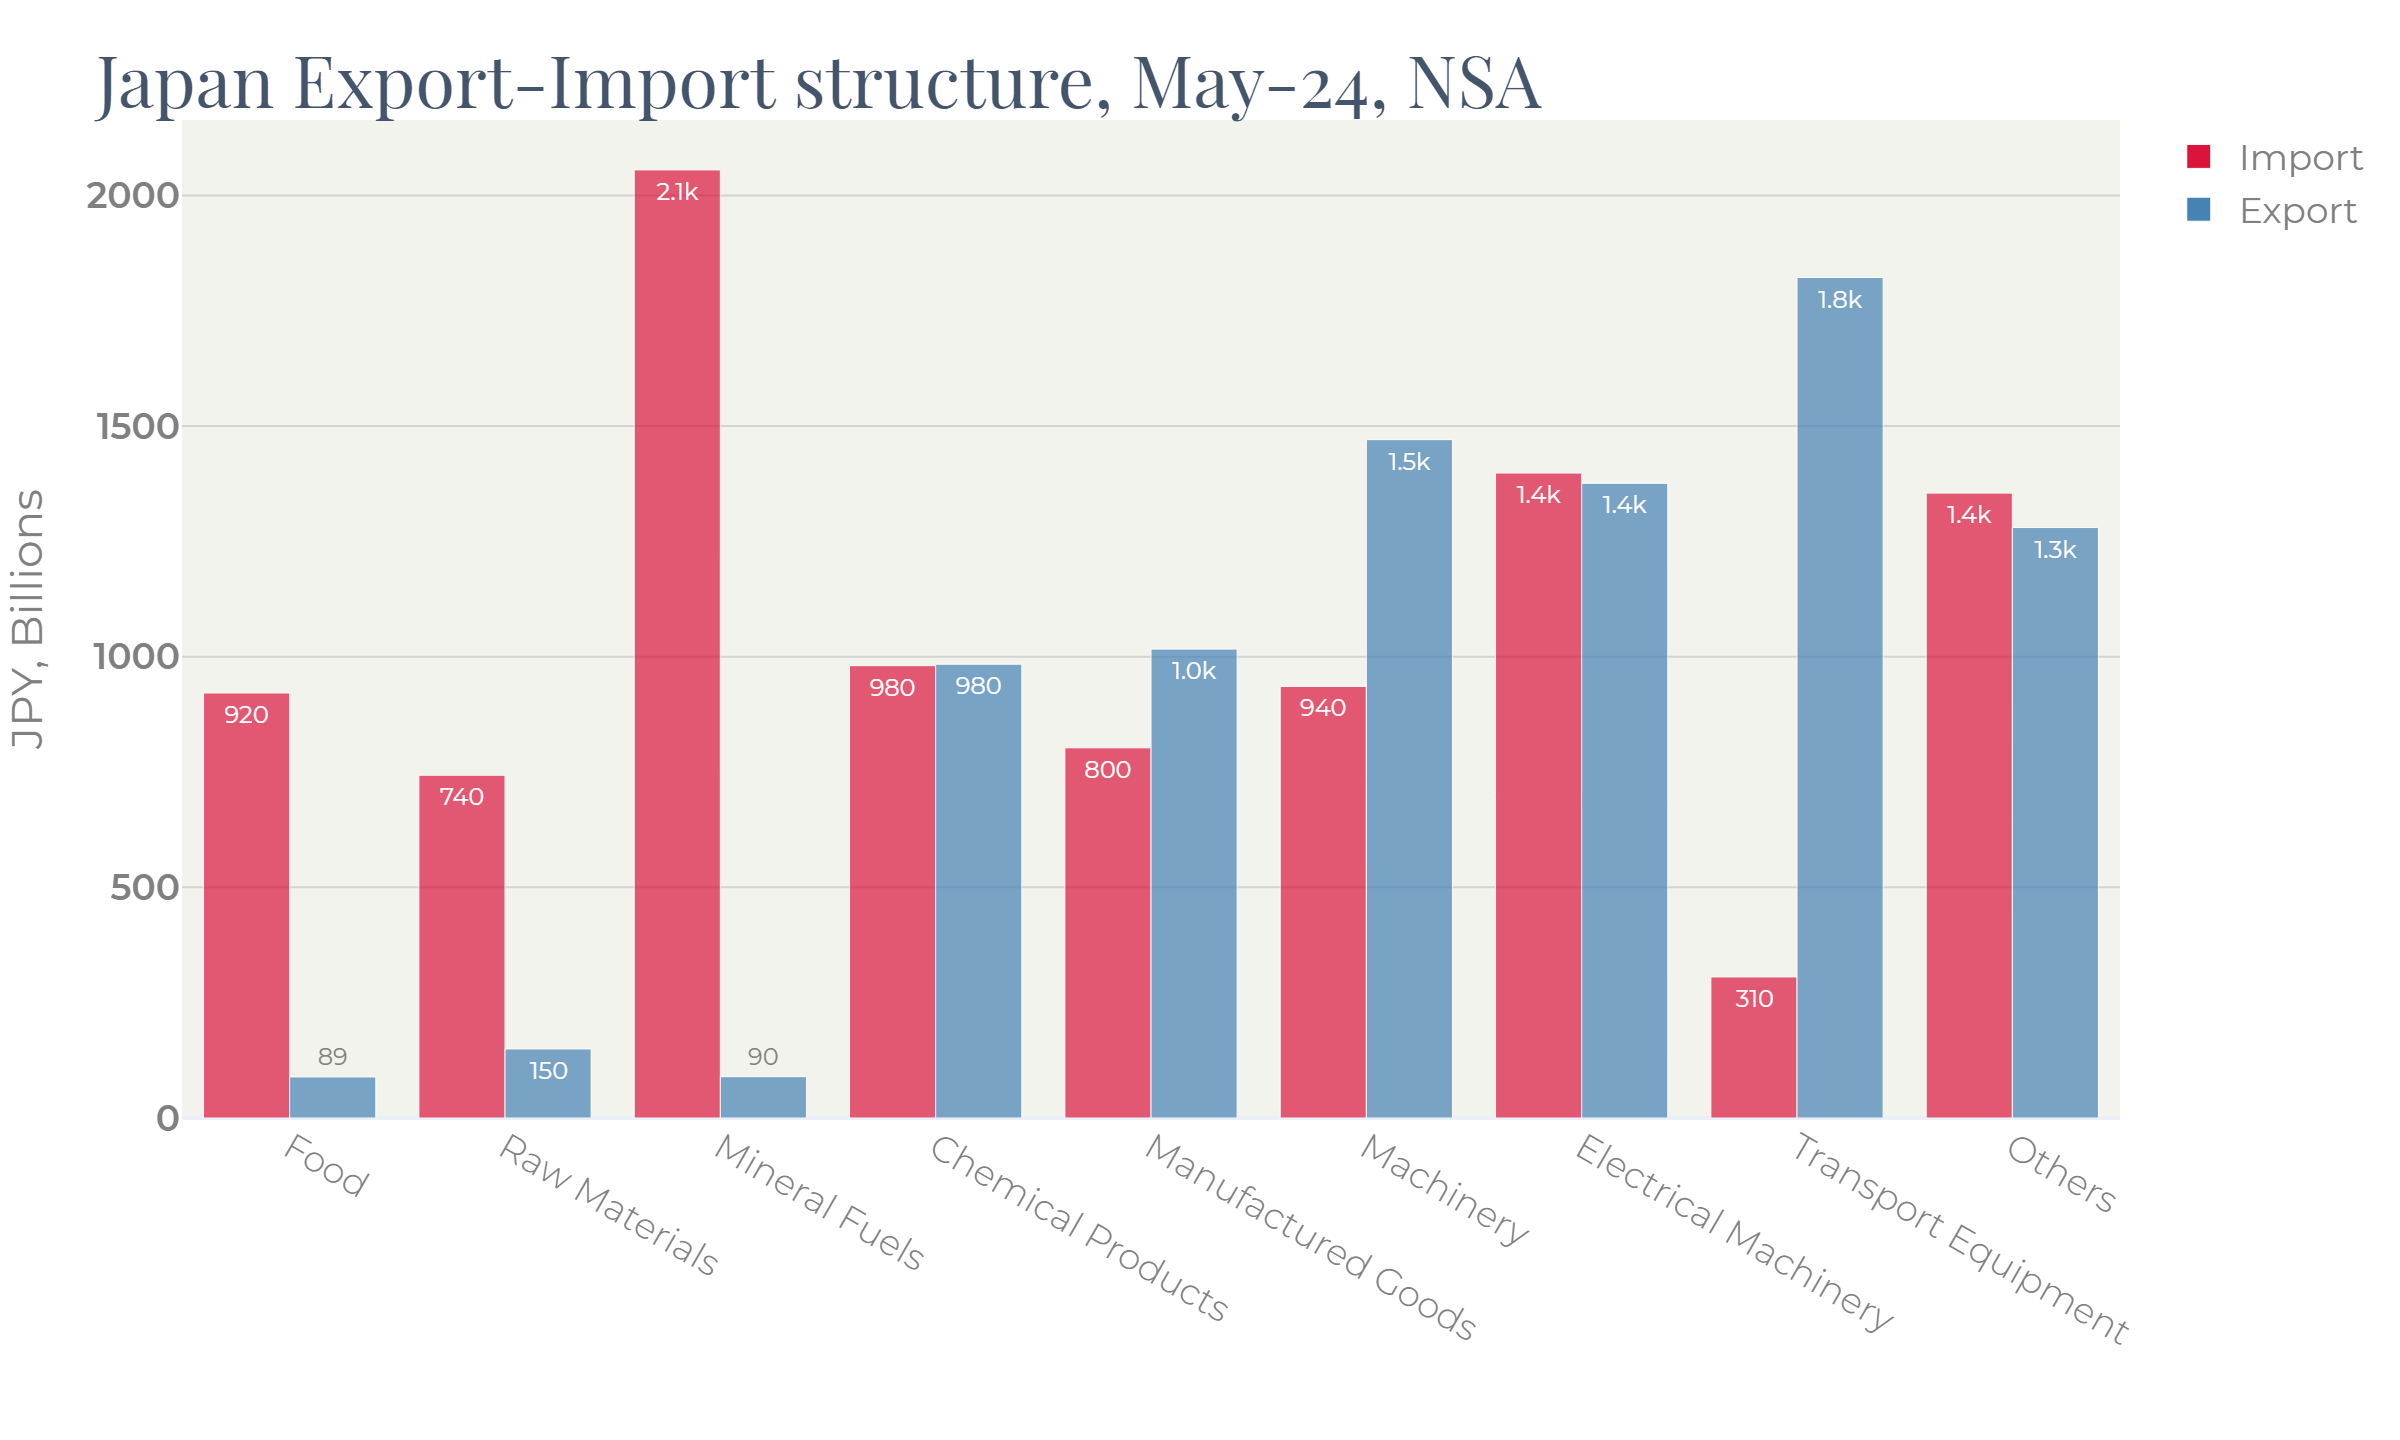
As Figure 3 demonstrates, Japan imports food, raw materials and mineral fuels, and exports manufactured goods, machinery and transport equipment.
The post-pandemic economic environment led to the price surge in all imported segments and capped demand for exported goods via high rates. So, the Japanese economy found itself caught between two factors negatively affecting its trade balance.
Apart of that, the financial account had also seriously deteriorated by 2023 (Figure 4). The combination of suffering economy, low local rates and high dollar rates reduced the appetite to invest in Japan.
As Figure 2 demonstrates, since 2010 the Japanese trade balance has more often been in the negative zone. Therefore, the strength of the yen depends on the attractiveness of the economy for investors: the positive financial account compensates for the negative trade balance.
Figure 4
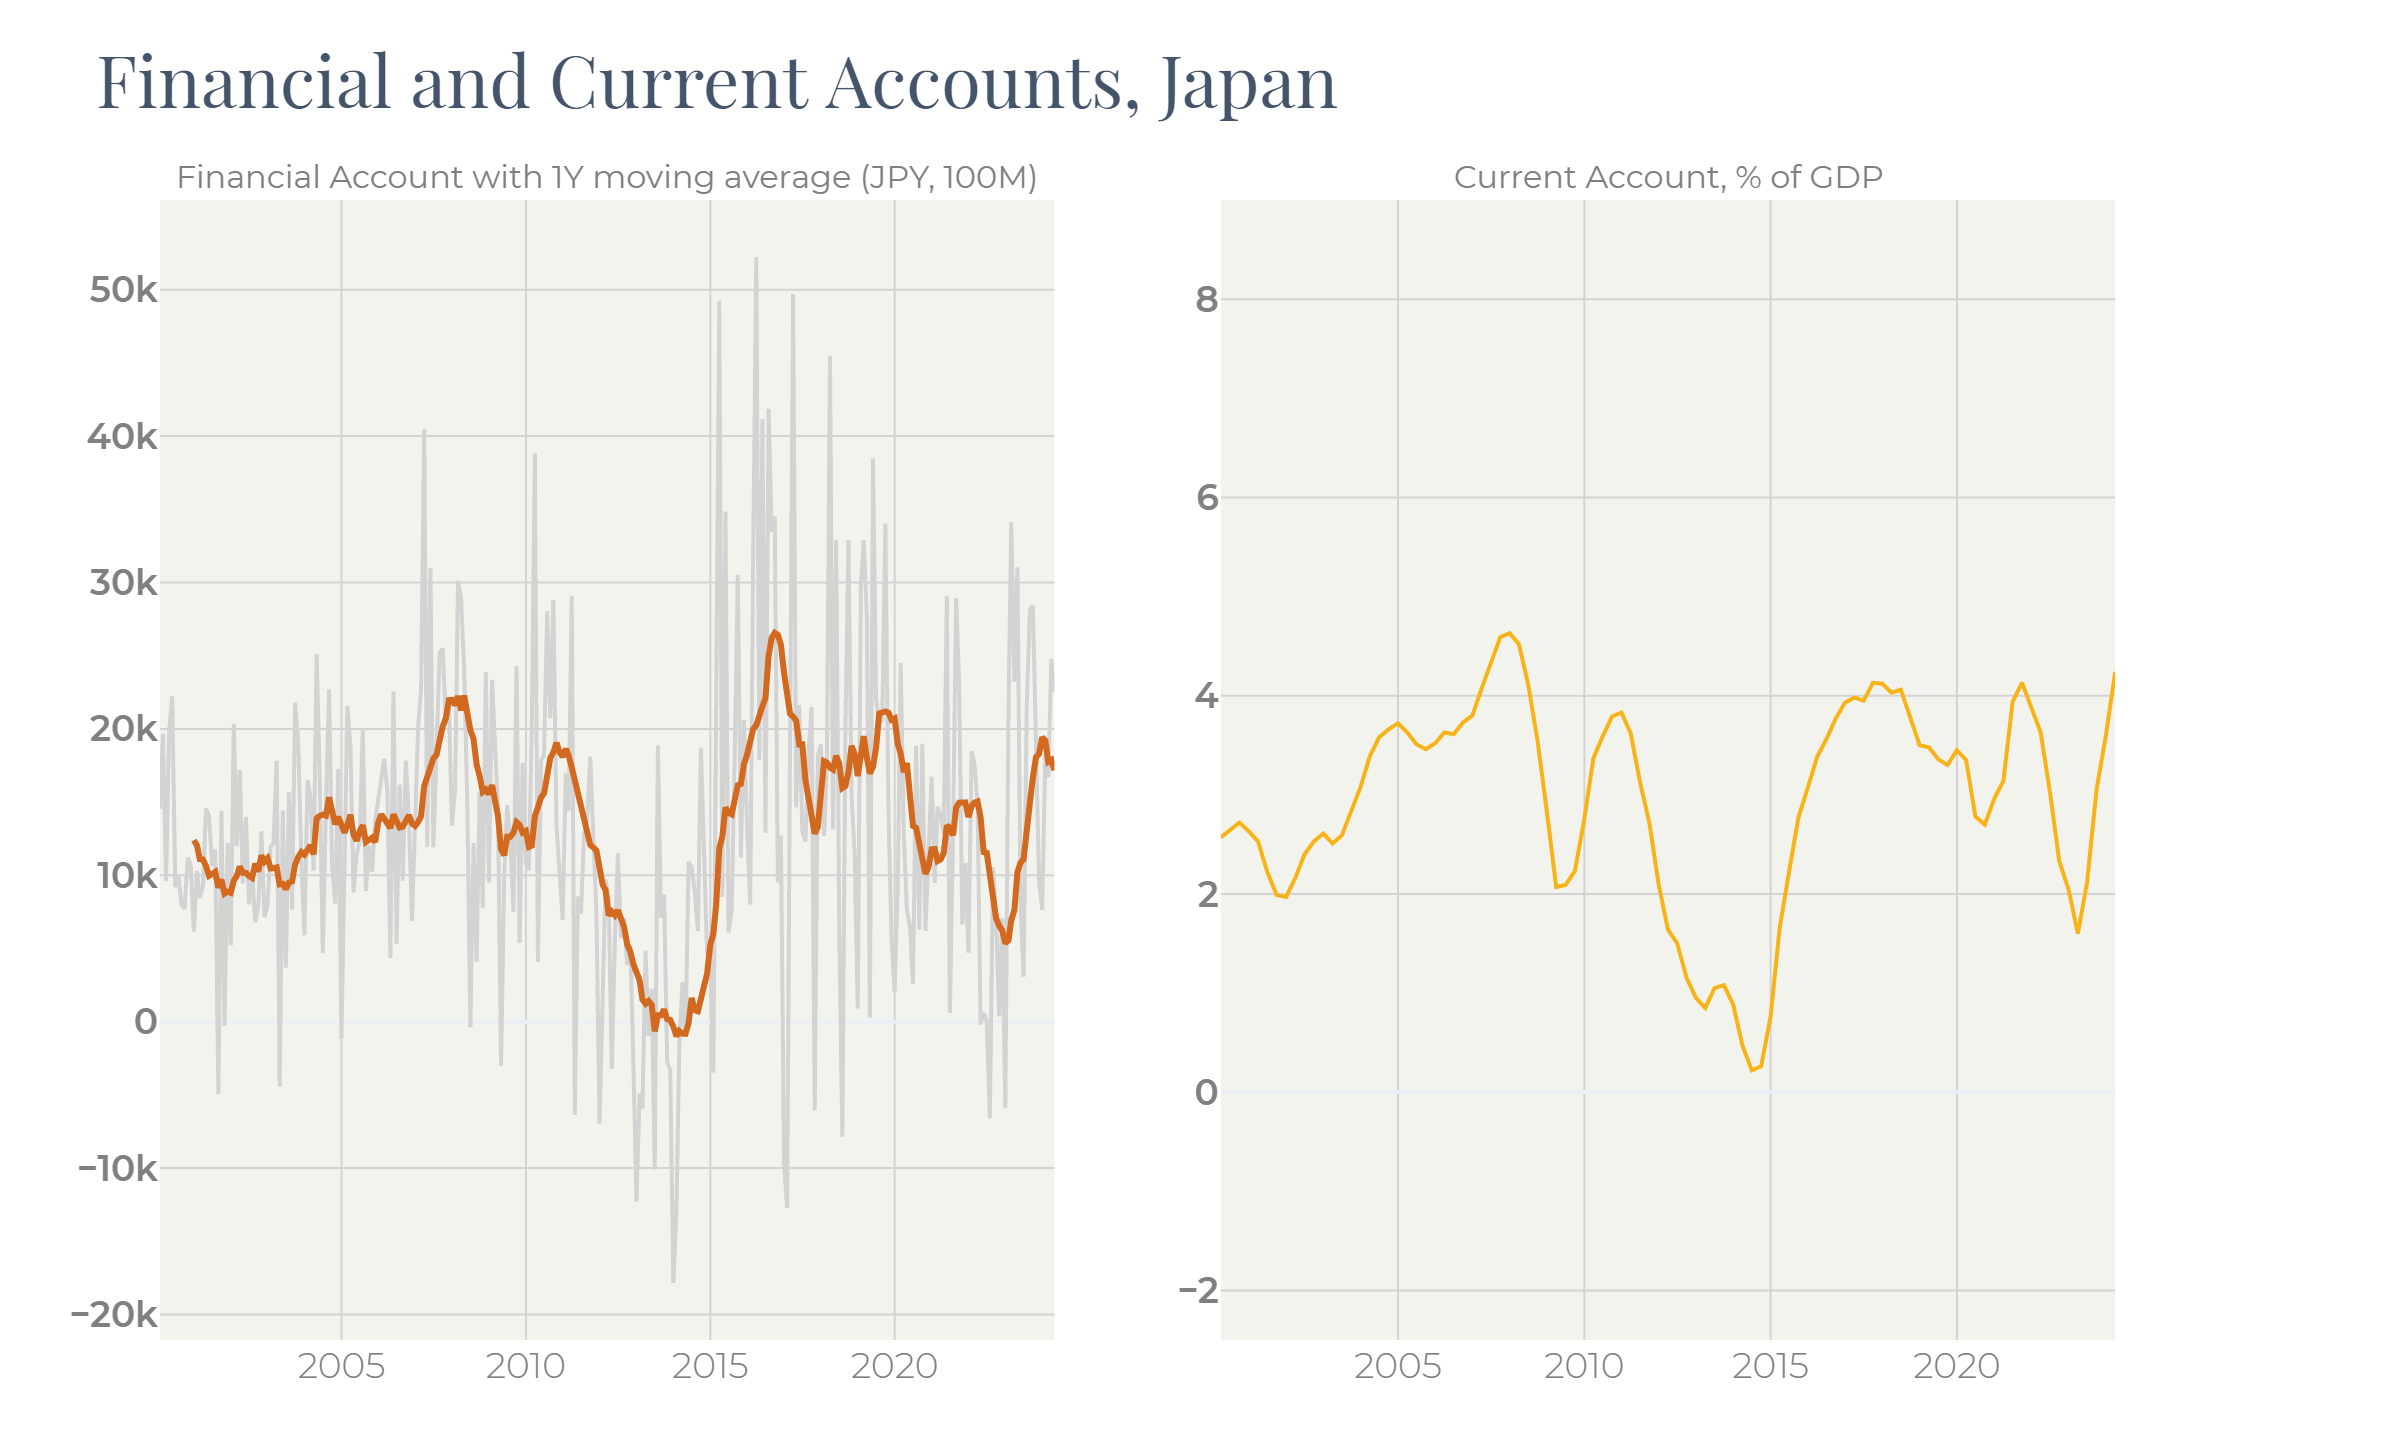
The ongoing devaluation of the yen has already improved the trade balance as well as the financial and current accounts. The latter exceeded 4% of GDP – the level, historically supporting the yen.
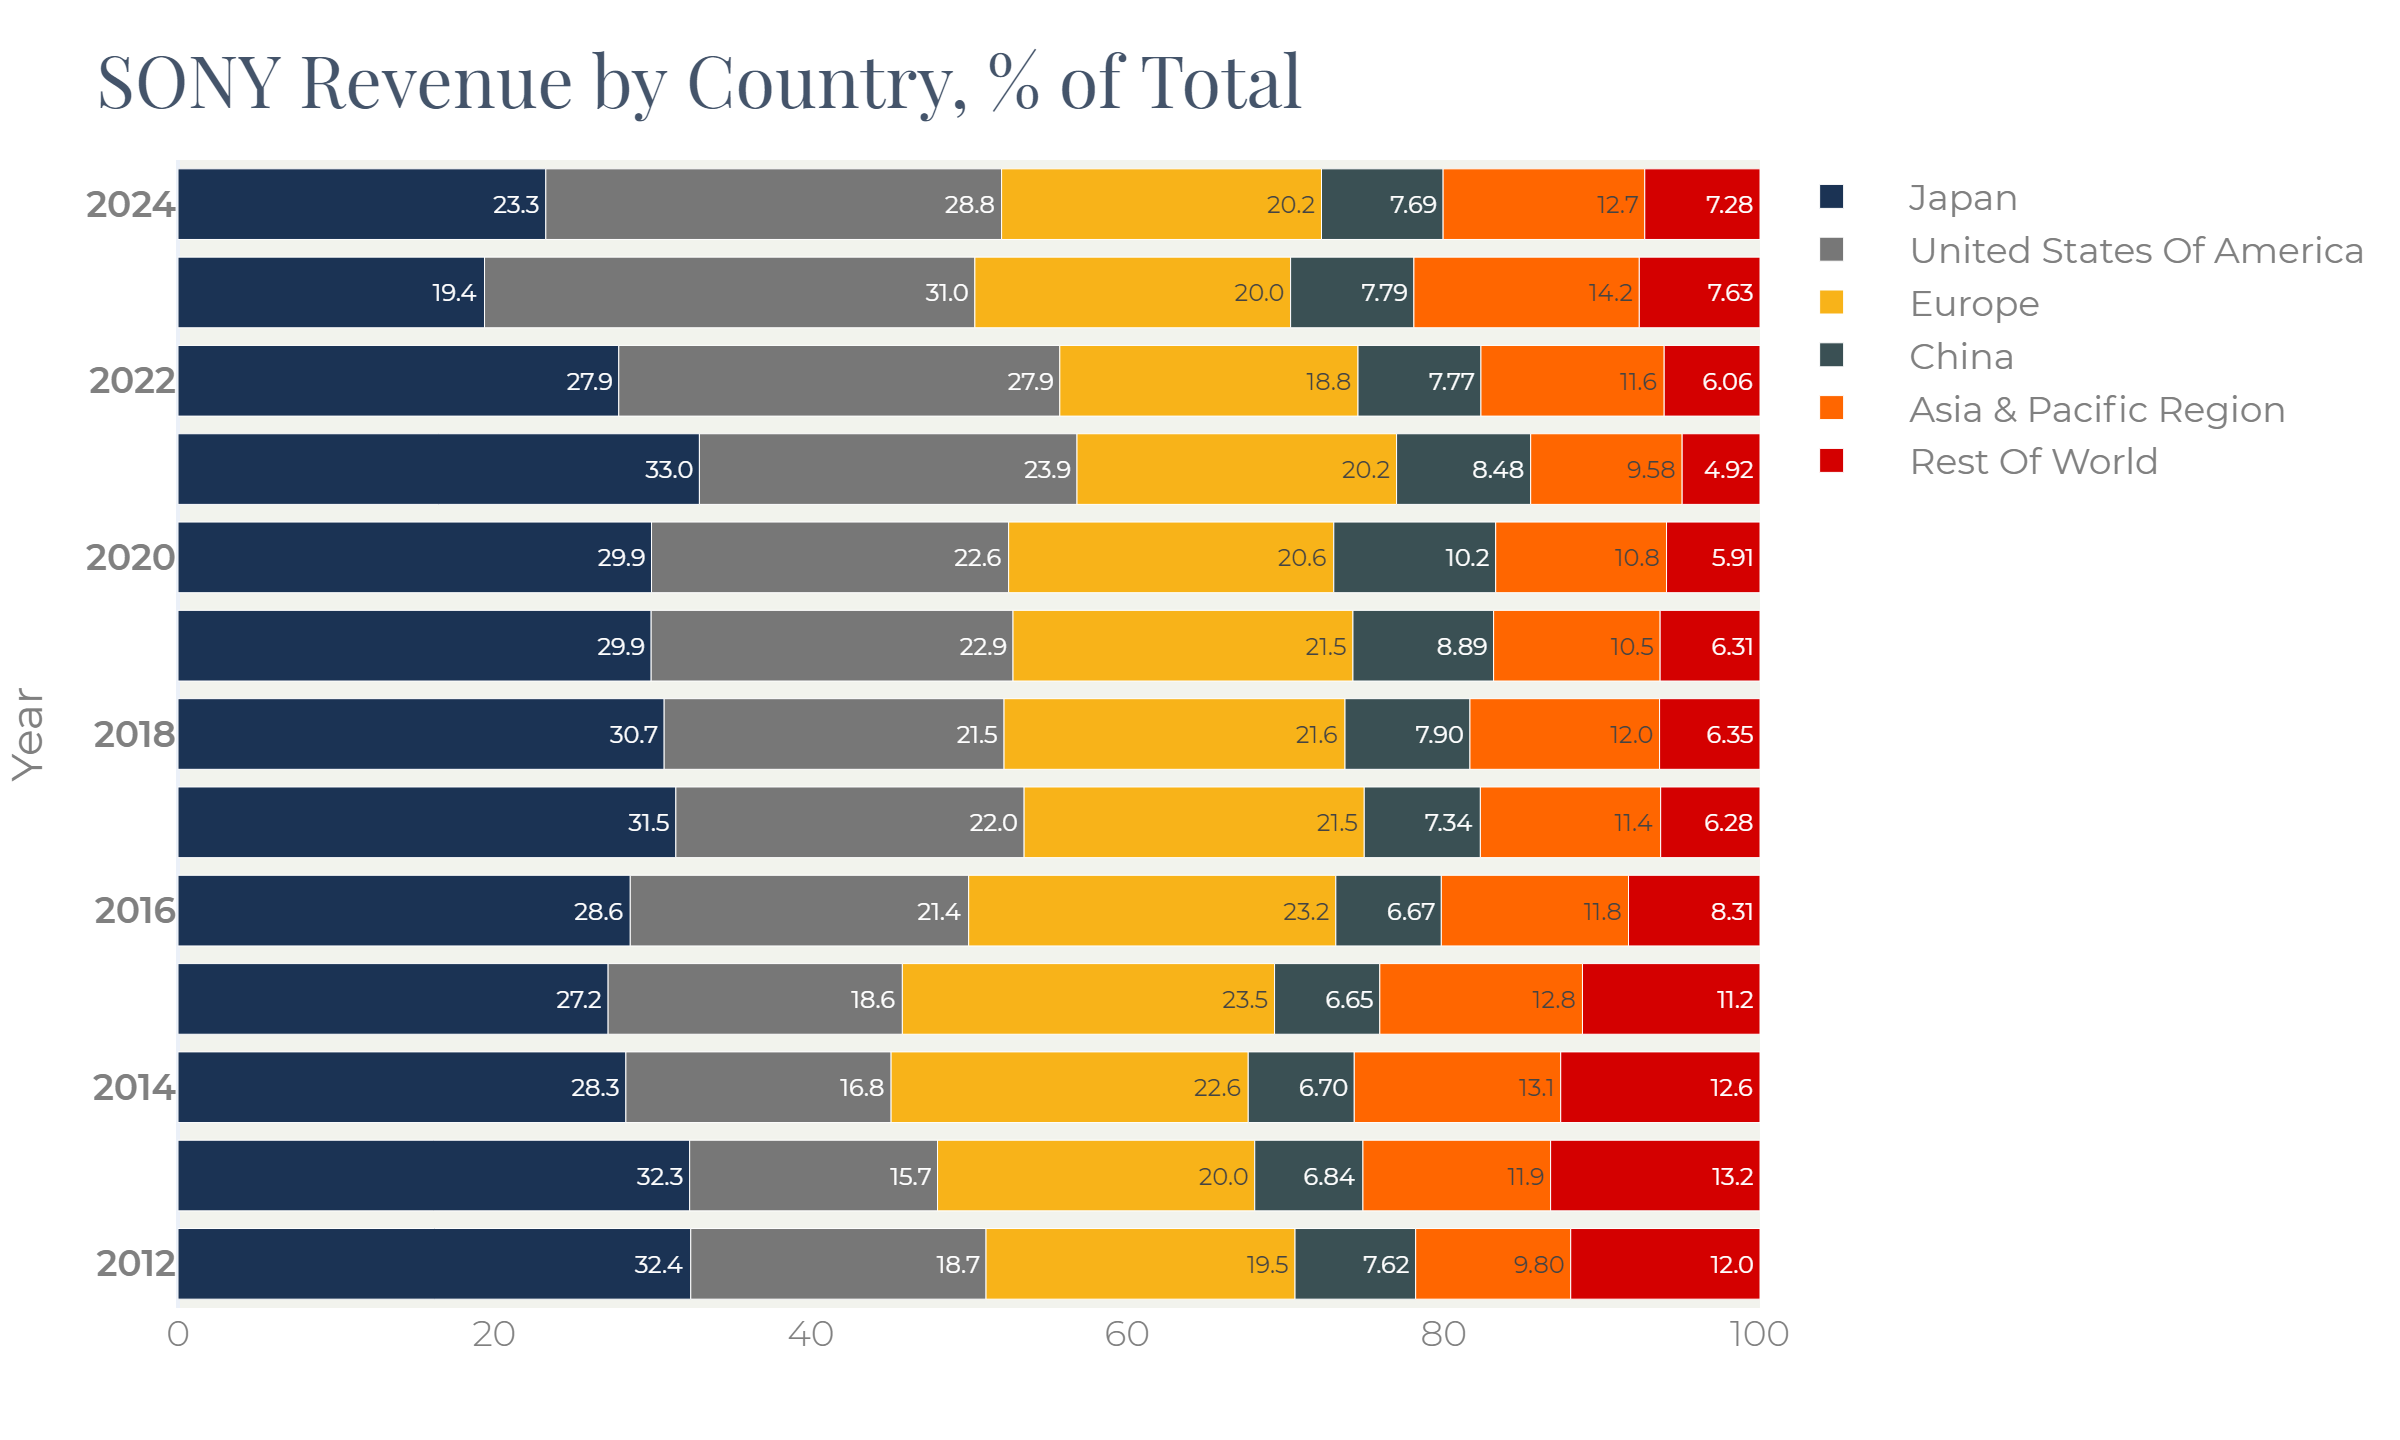
Figure 5 displays the revenue breakdown of one of the largest Japanese companies – SONY. Local consumption has slid and was replaced, above all, by US demand. European export as well as the Chinese one is steady highlighting the weakness of both economies.
Figure 5
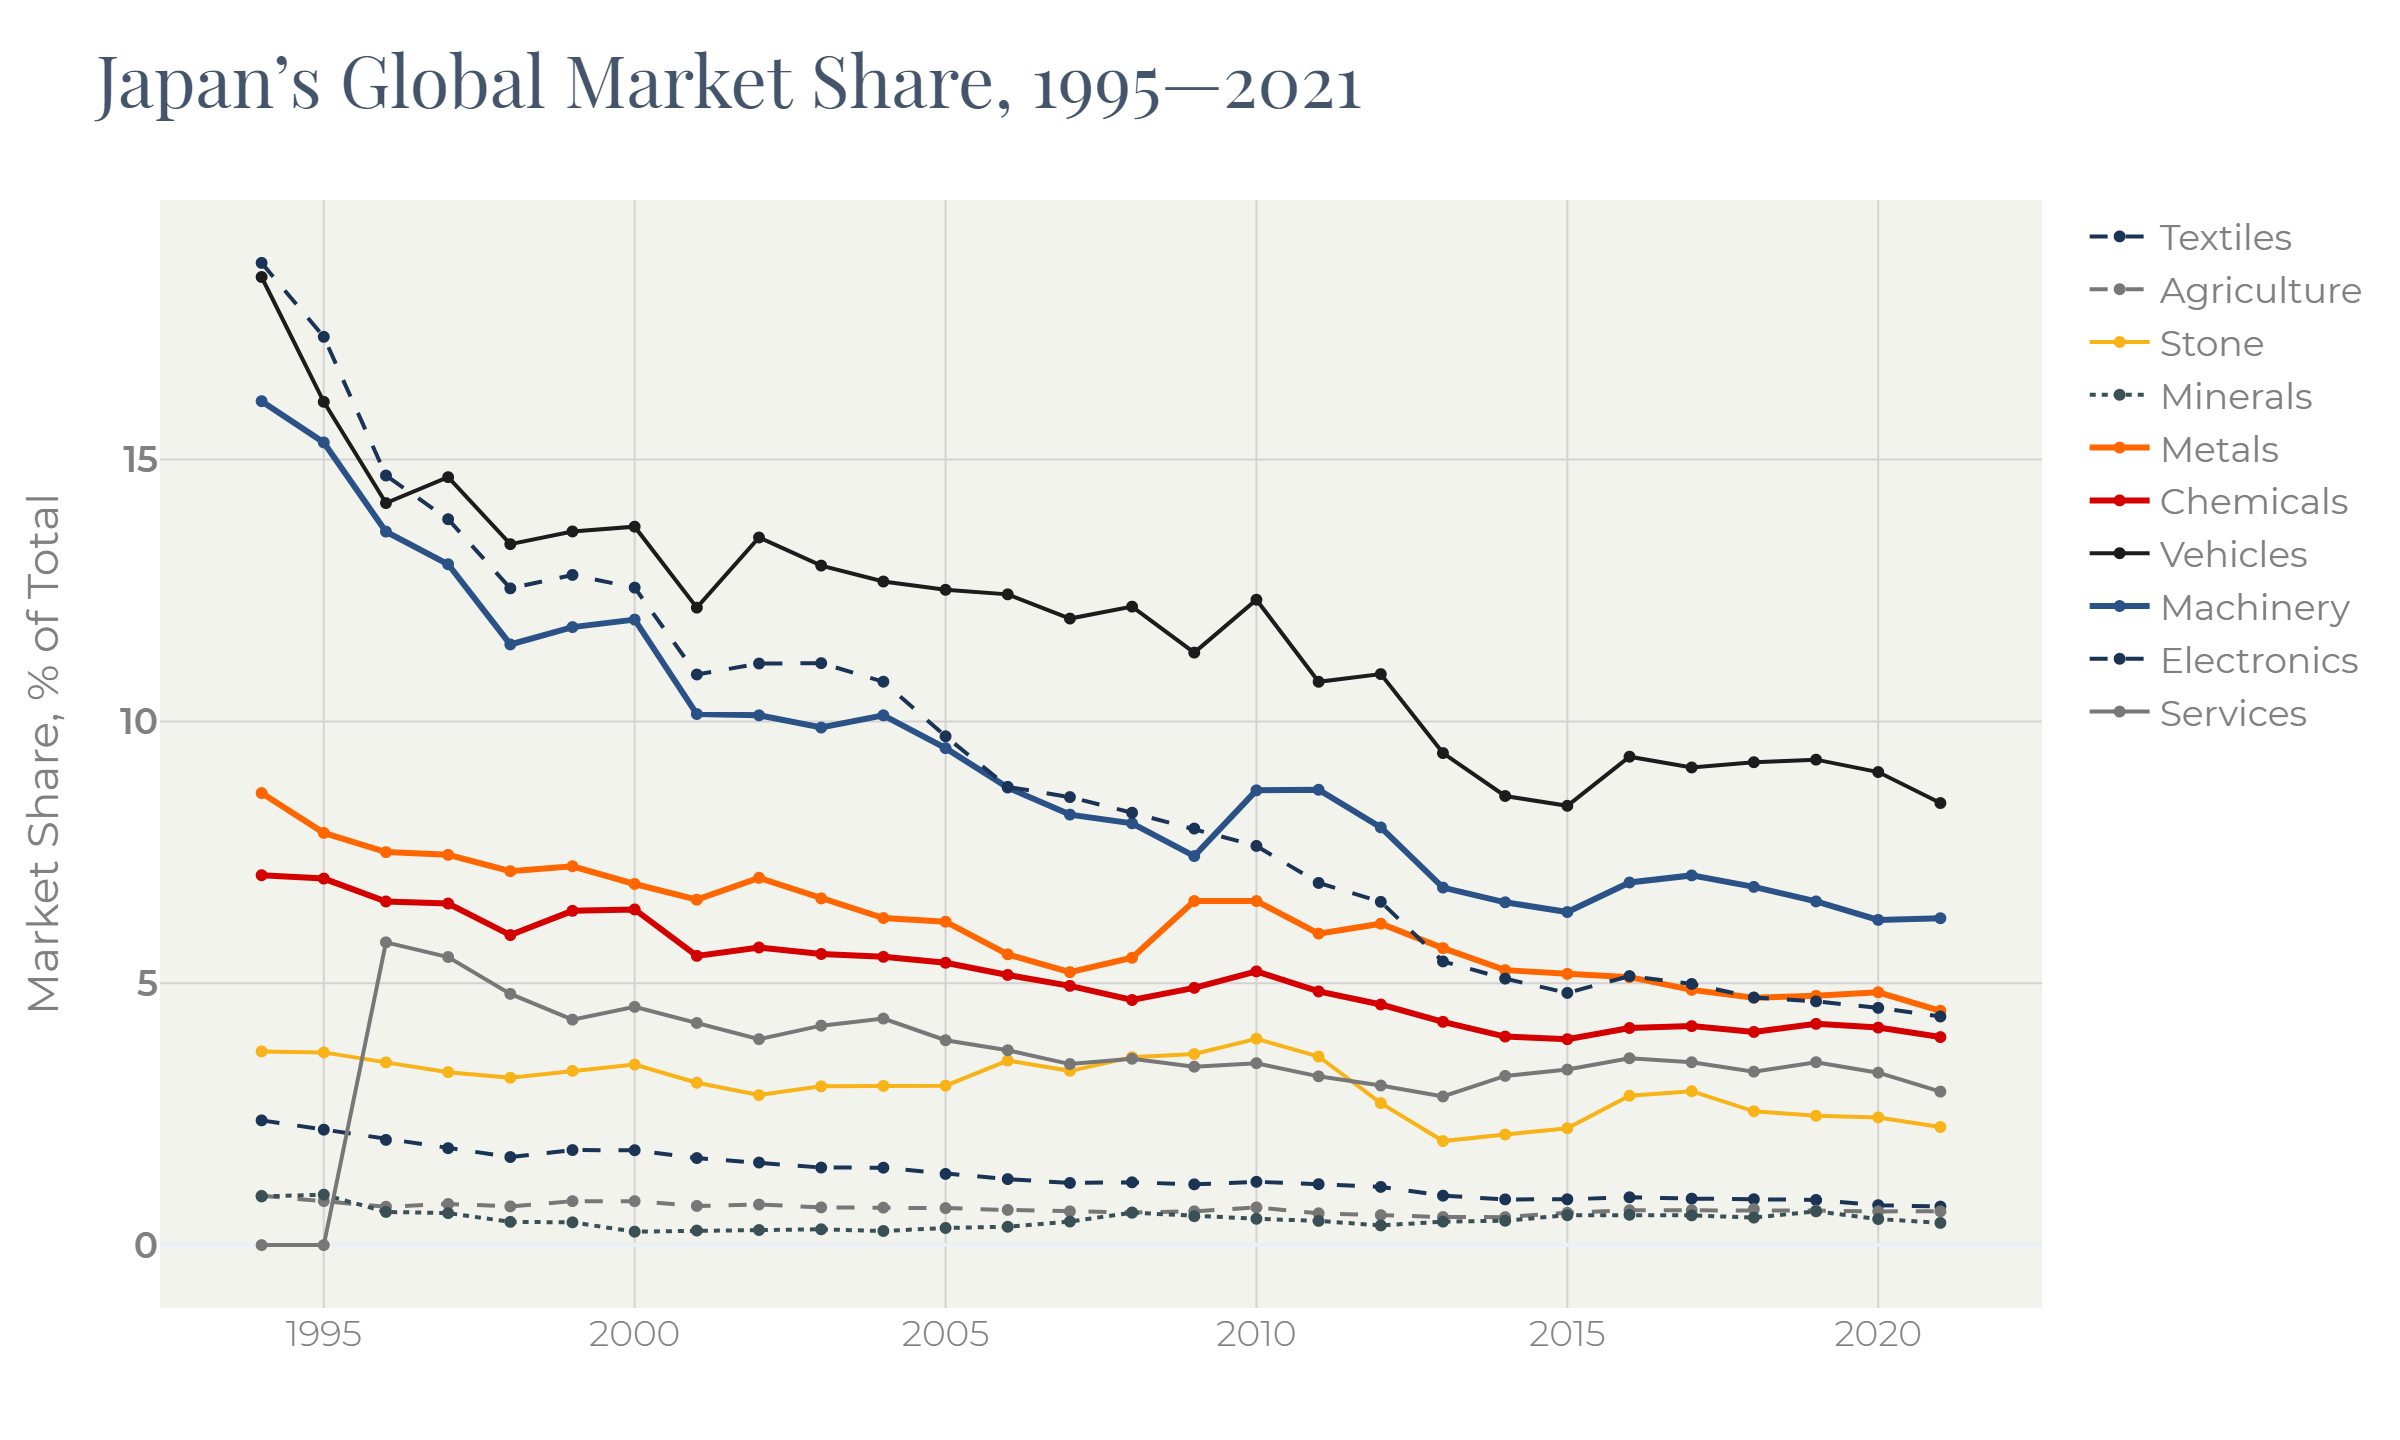
The Japanese export has been under pressure since 1990s when a serious shift in favor of less developed economies, primarily China, was made. Over the past 25 years Japan has been in constant survival race with the rest of the world protecting its position in the global economy. This battle is not quite successful for Japan: its share in the global trade has been constantly decreasing:
Figure 6
Monetary policy in Japan
After an impressive rally, the Japanese stock market reversed in 1990 and switched to the depression which lasted almost 25 years. In September 1991 BOJ first reduced the key rate by 50bp from then level of 6%. In 1999 the key rate reached 0% where, plus or minus small swings, it has fluctuated until now:
Figure 7
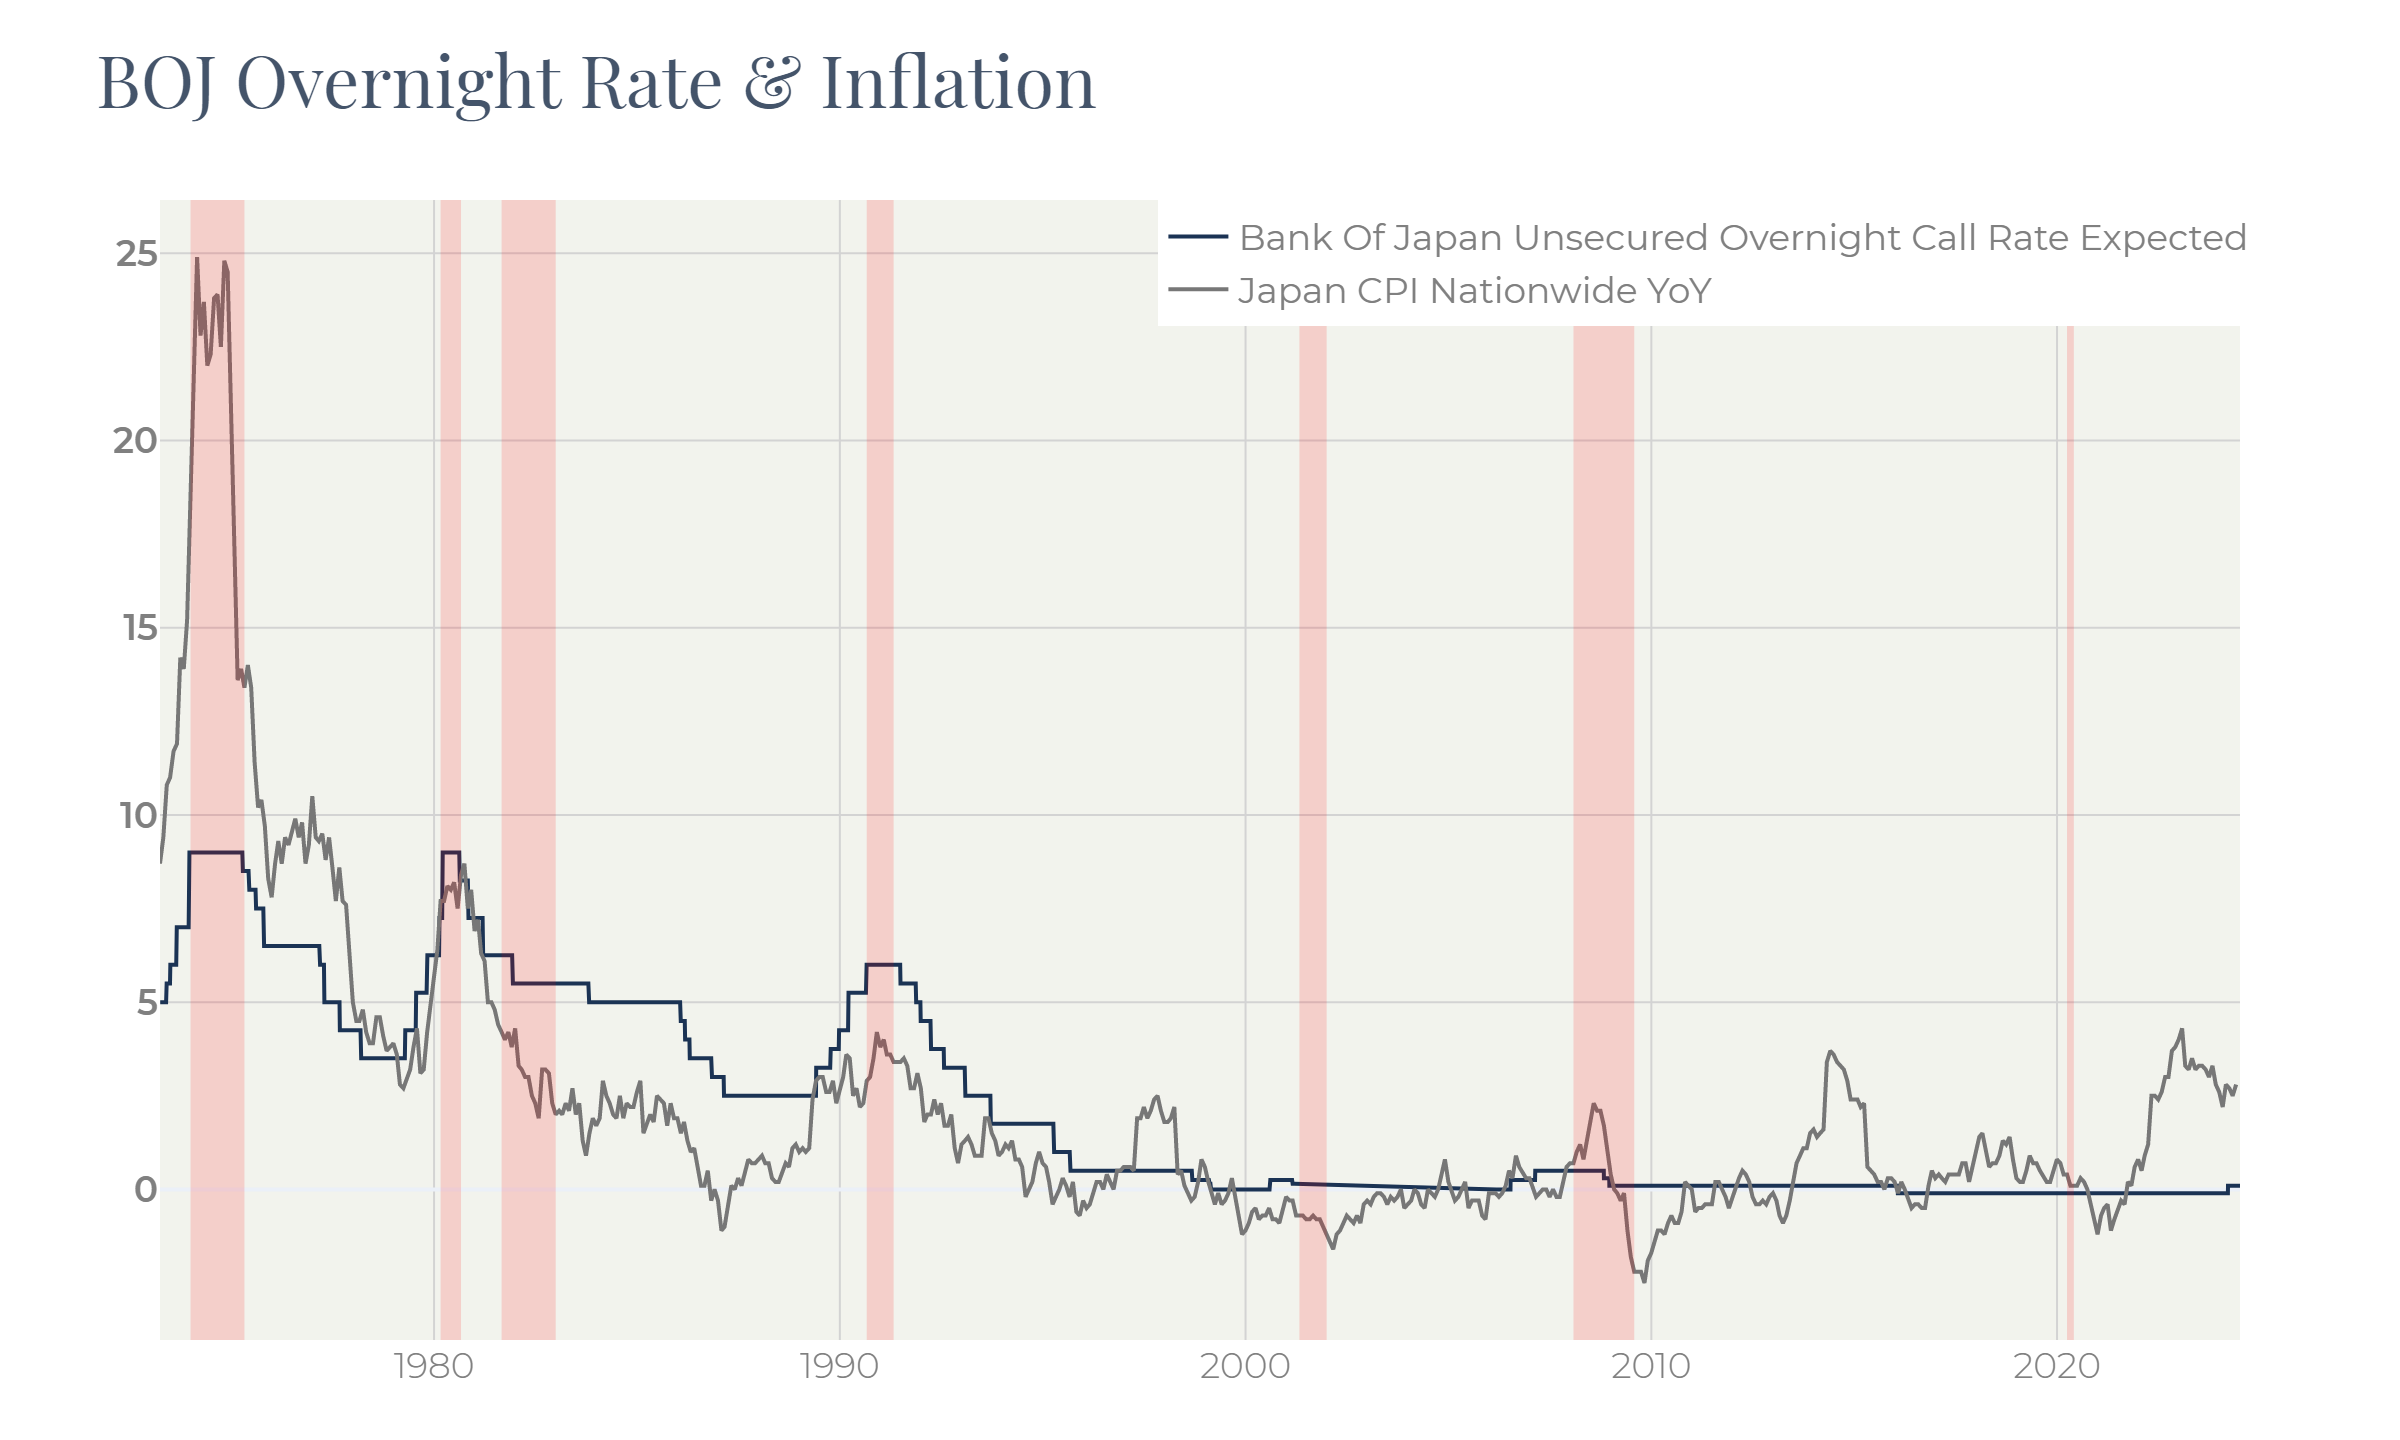
Over this period the monetary authorities have been trying to push inflation closer to the 2% target, without meaningful success.
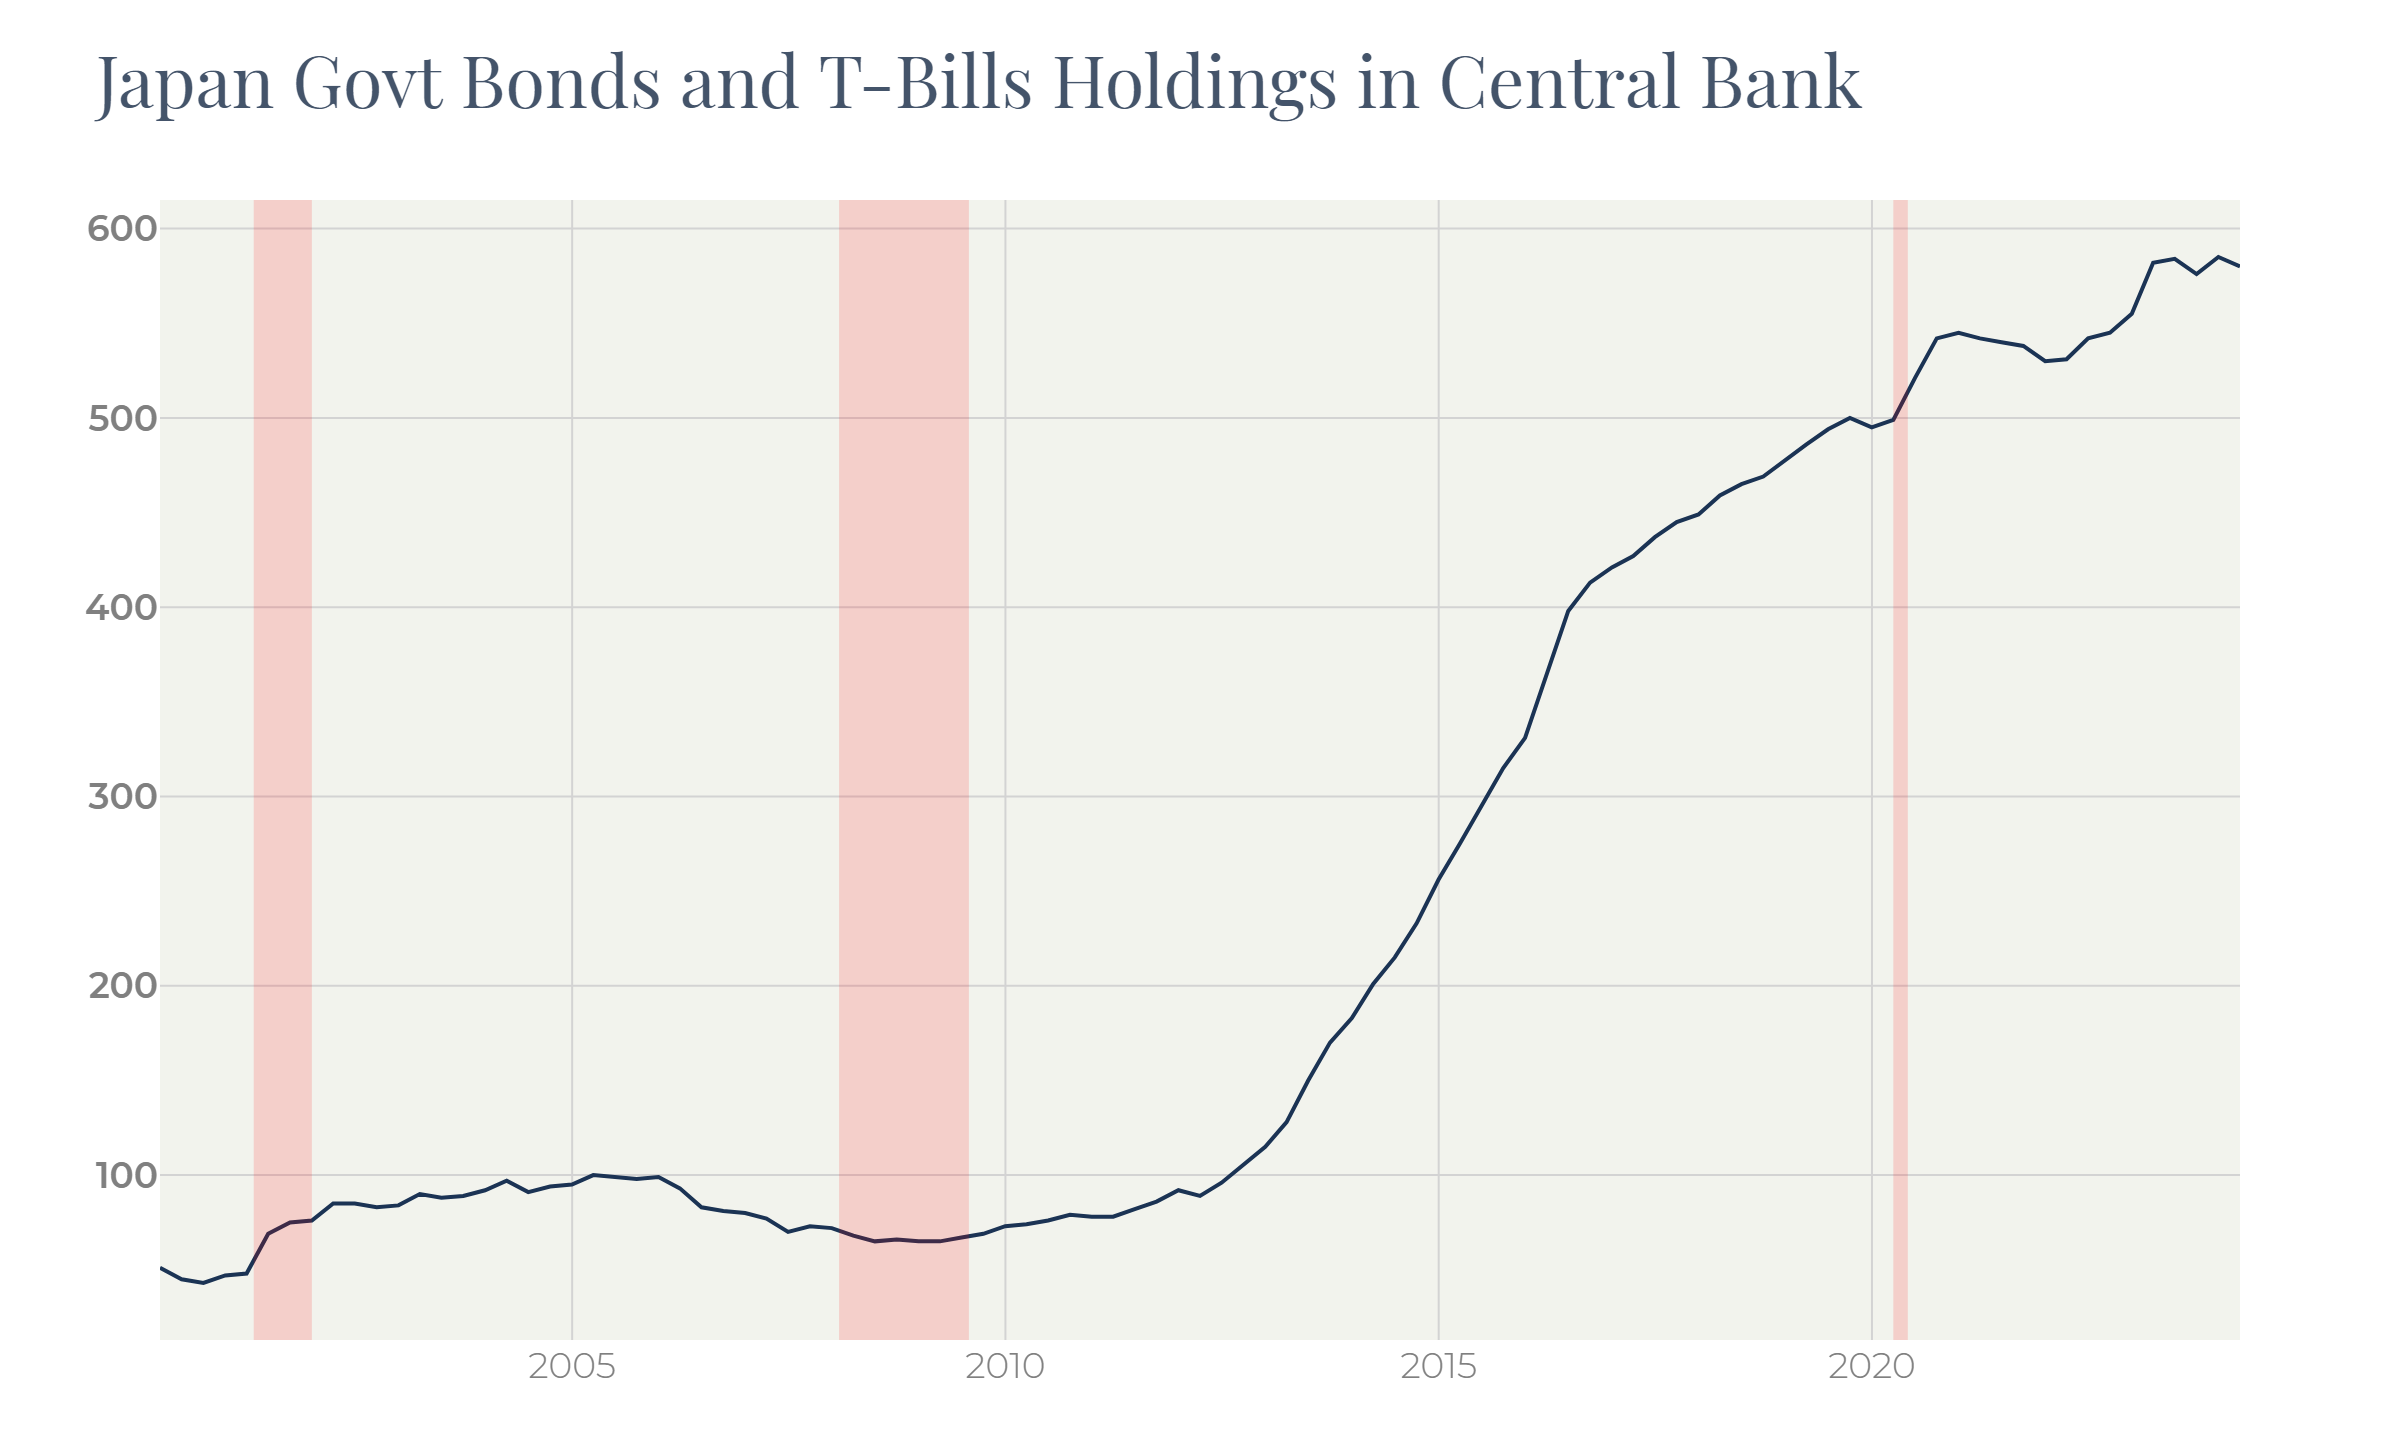
Despite the low-rate environment, the Japanese economy kept suffering from the competition to other markets, especially Chinese. In 2012 the GDP growth in Japan remained negative three quarters in a row, without BOJ being able to stimulate the economy through lowering the key rate. With this backdrop, the Bank of Japan started massive QE. It increased its bond holdings from 100t yen to almost 600t yen over the next decade:
Figure 8
This policy, aiming to supporting economy and pushing inflation up, only led to a small spike of inflation (Figure 7), weakness of the yen (Figure 1) and drop of the trade balance and the current account (Figure 4).
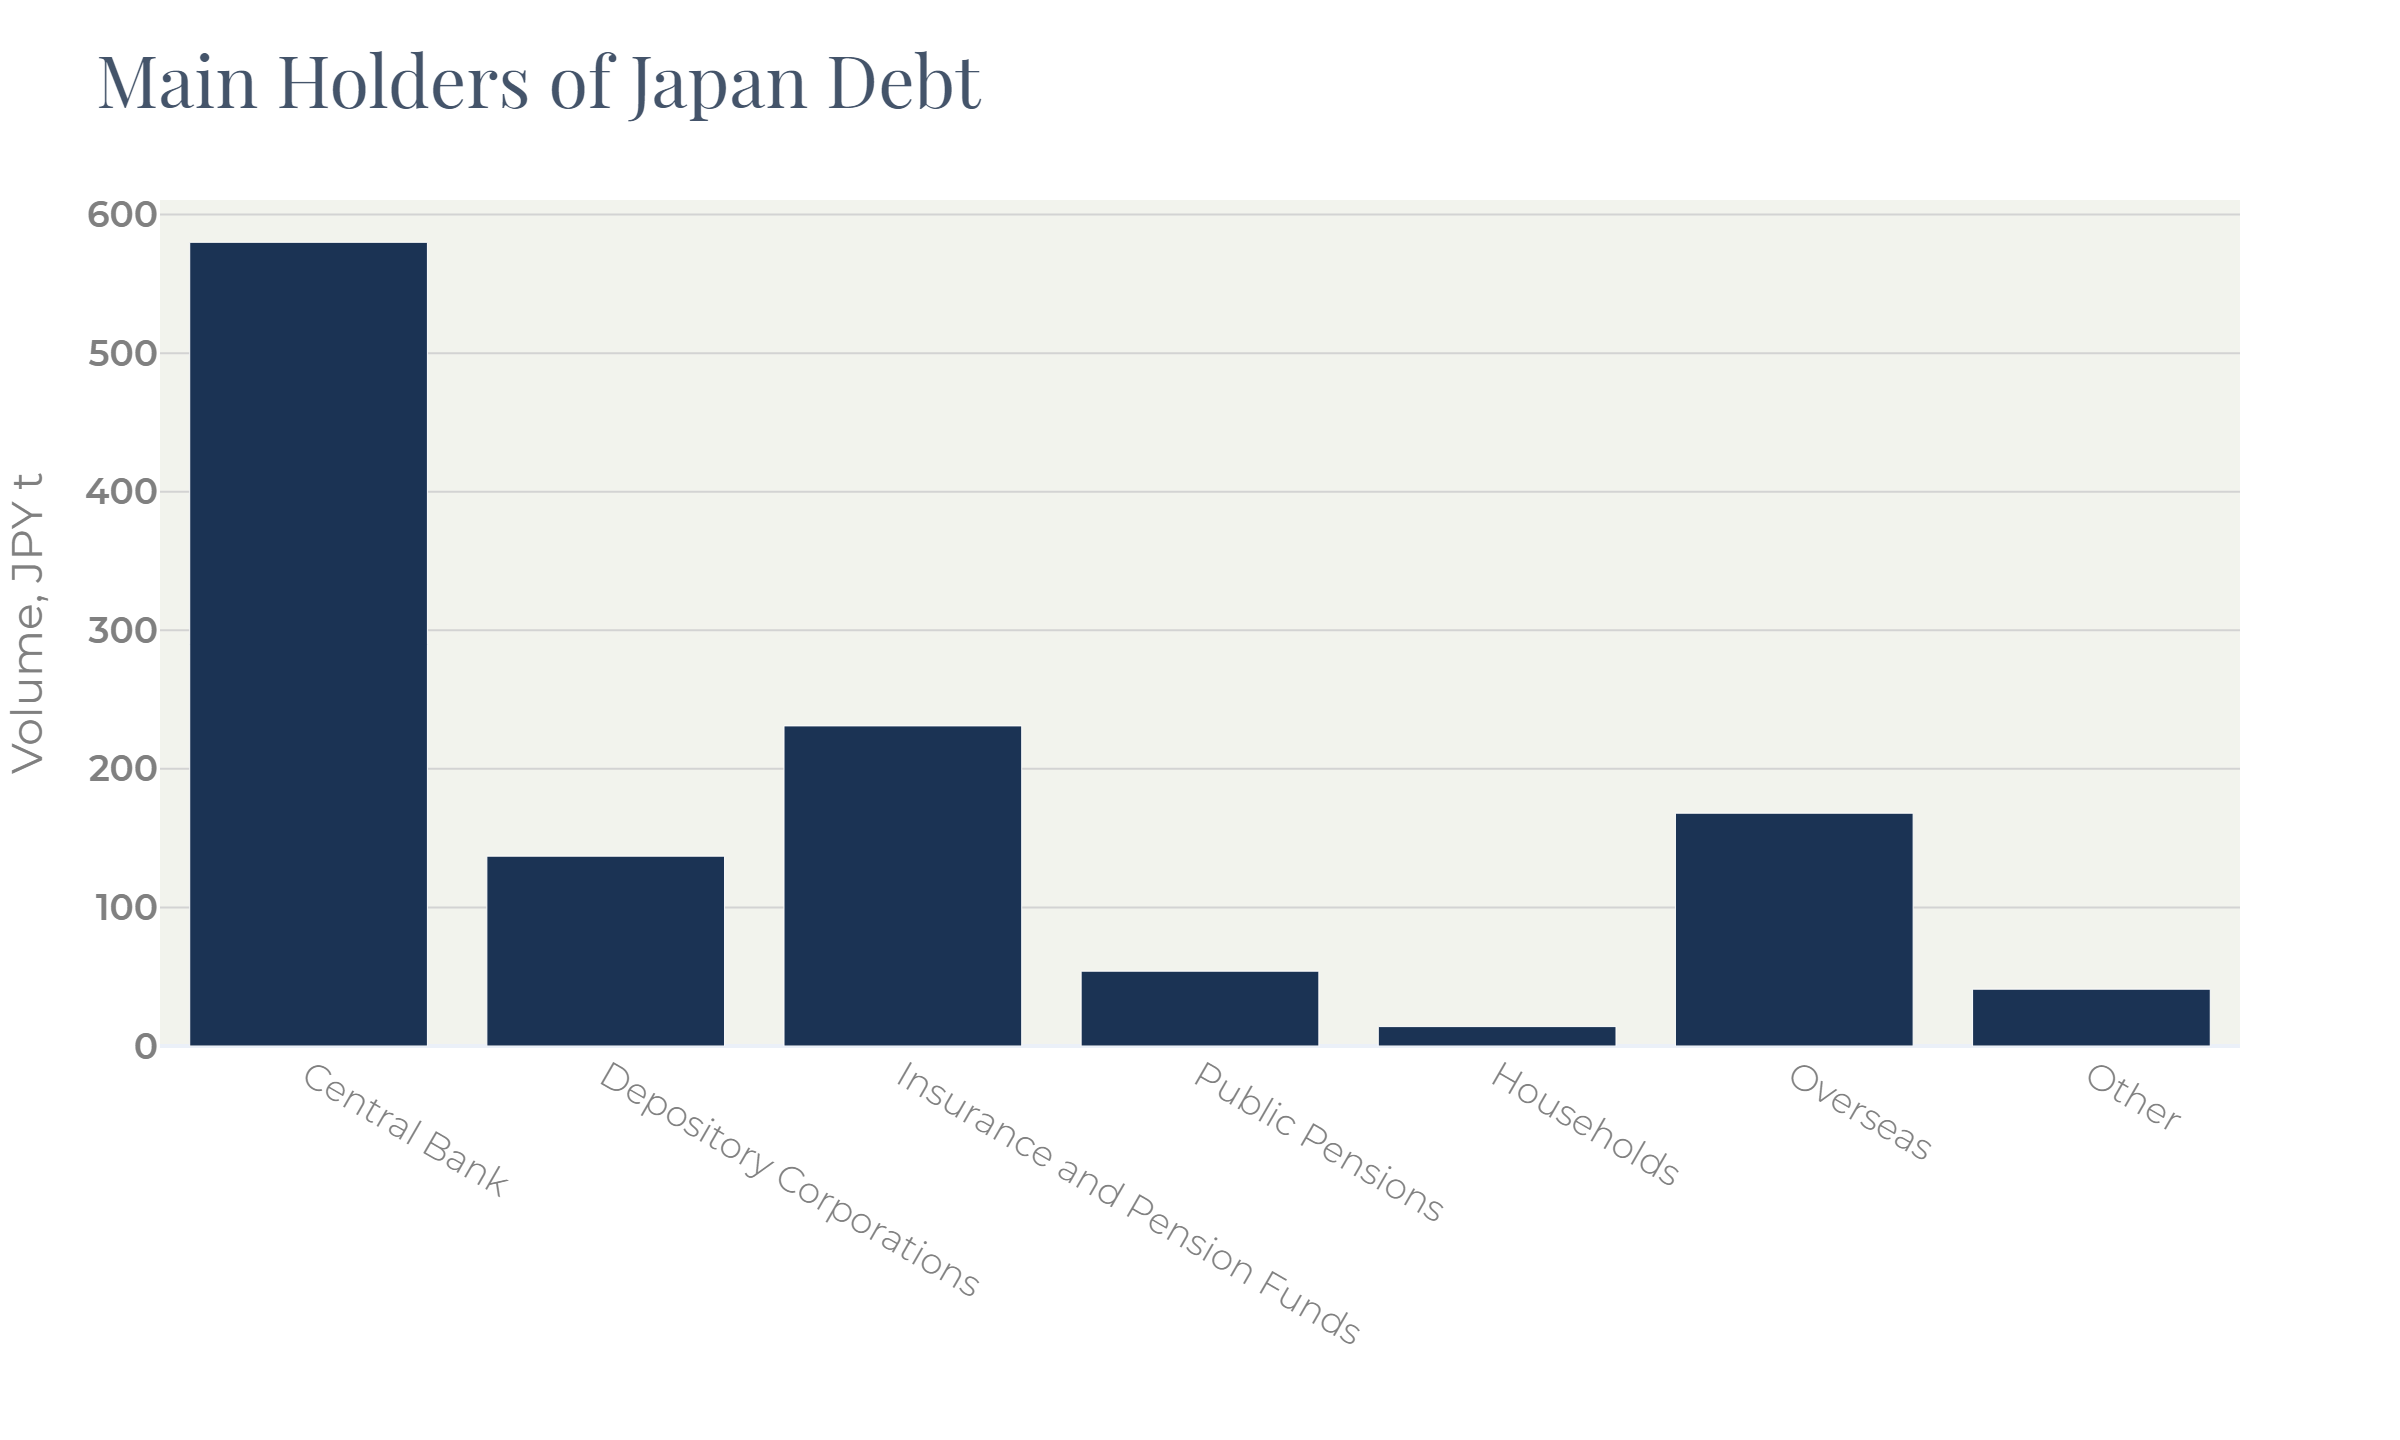
The Central Bank, in turn, became the largest holder of Japan debt:
Figure 9
Even before the BoJ started QE through bonds purchasing, the Japan Government debt had risen above 200% of GDP:
Figure 10
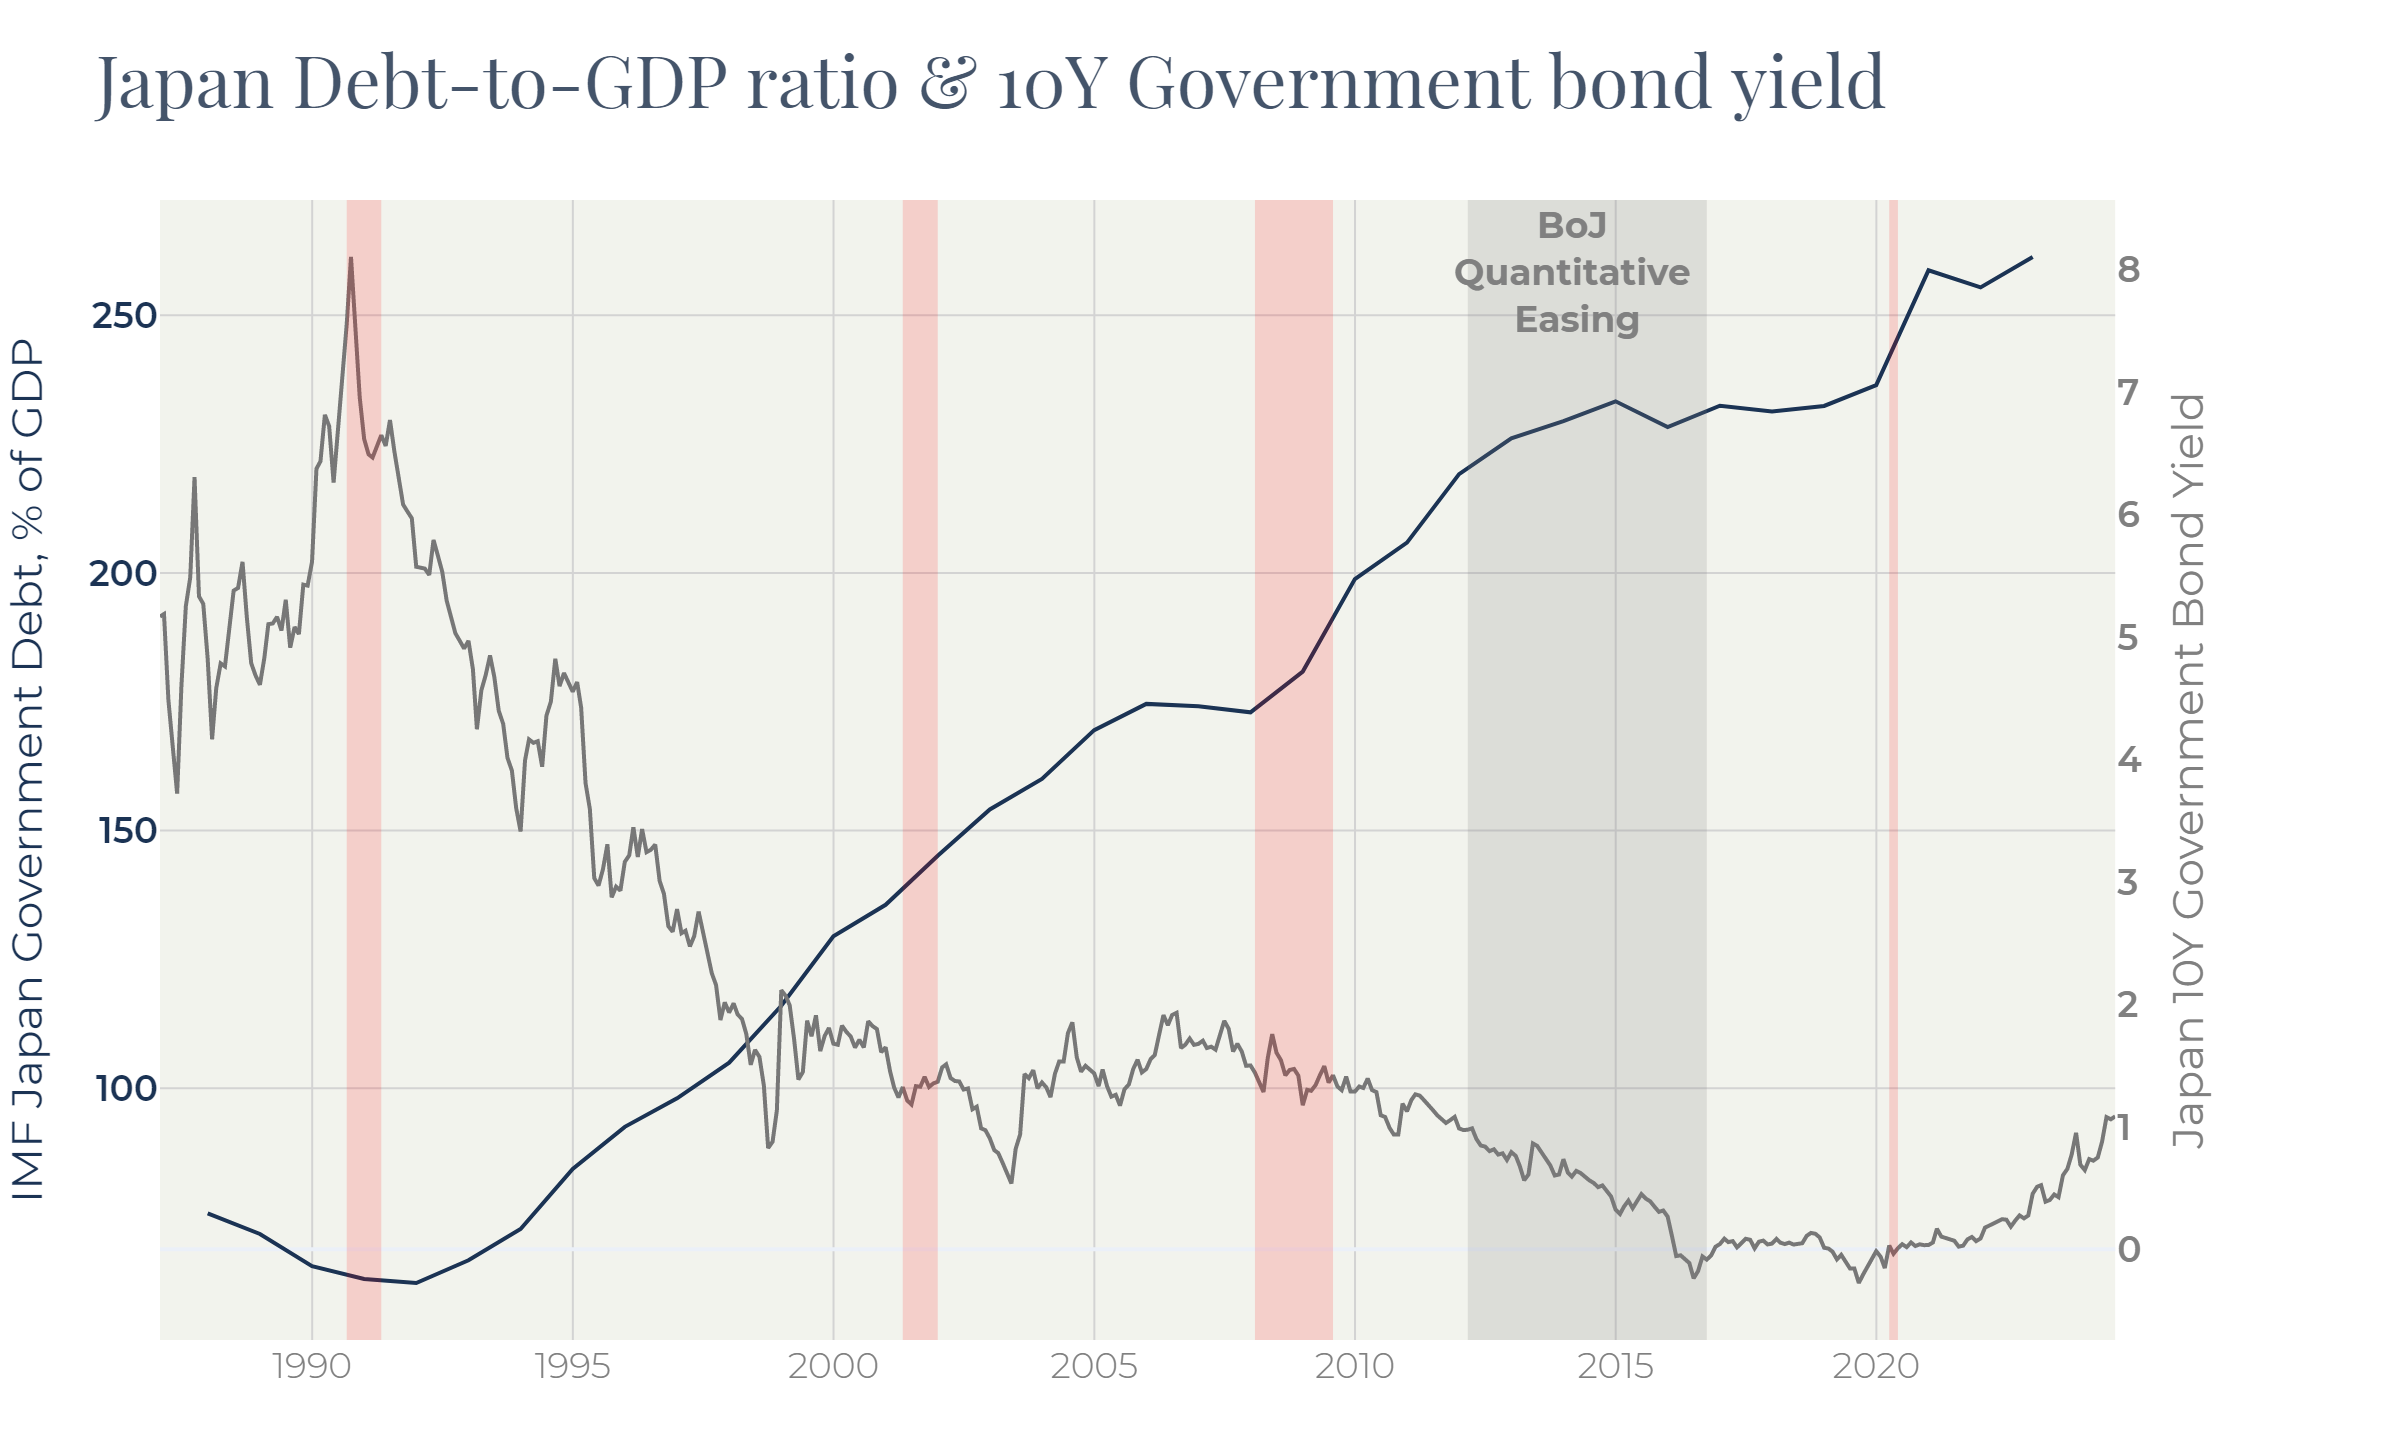
It is interesting that the period of the most aggressive BoJ operations (highlighted with grey on Figure 10, see also Figure 8) did not result in rise of Debt-to-GDP ratio. By that moment, yield of 10Y Japanese Government bonds had reached 1%. The BoJ bond purchase program sent yields even lower – to 0%. Investors began seeking alternative investments: it was very hard to justify investments in a devaluing currency yielding zero return. Investors outflow caused a serious yen devaluation: it weakened by 25% against the dollar over 2012—2016 BoJ QE period (Figure 1).
Slowing down of QE happened in 2016, marked the end of the long-term downtrend in Japan bonds yields.
Japan locked itself in the zero-percent rate environment not knowing what to do to stimulate the stagnating economy and how to push inflation up.
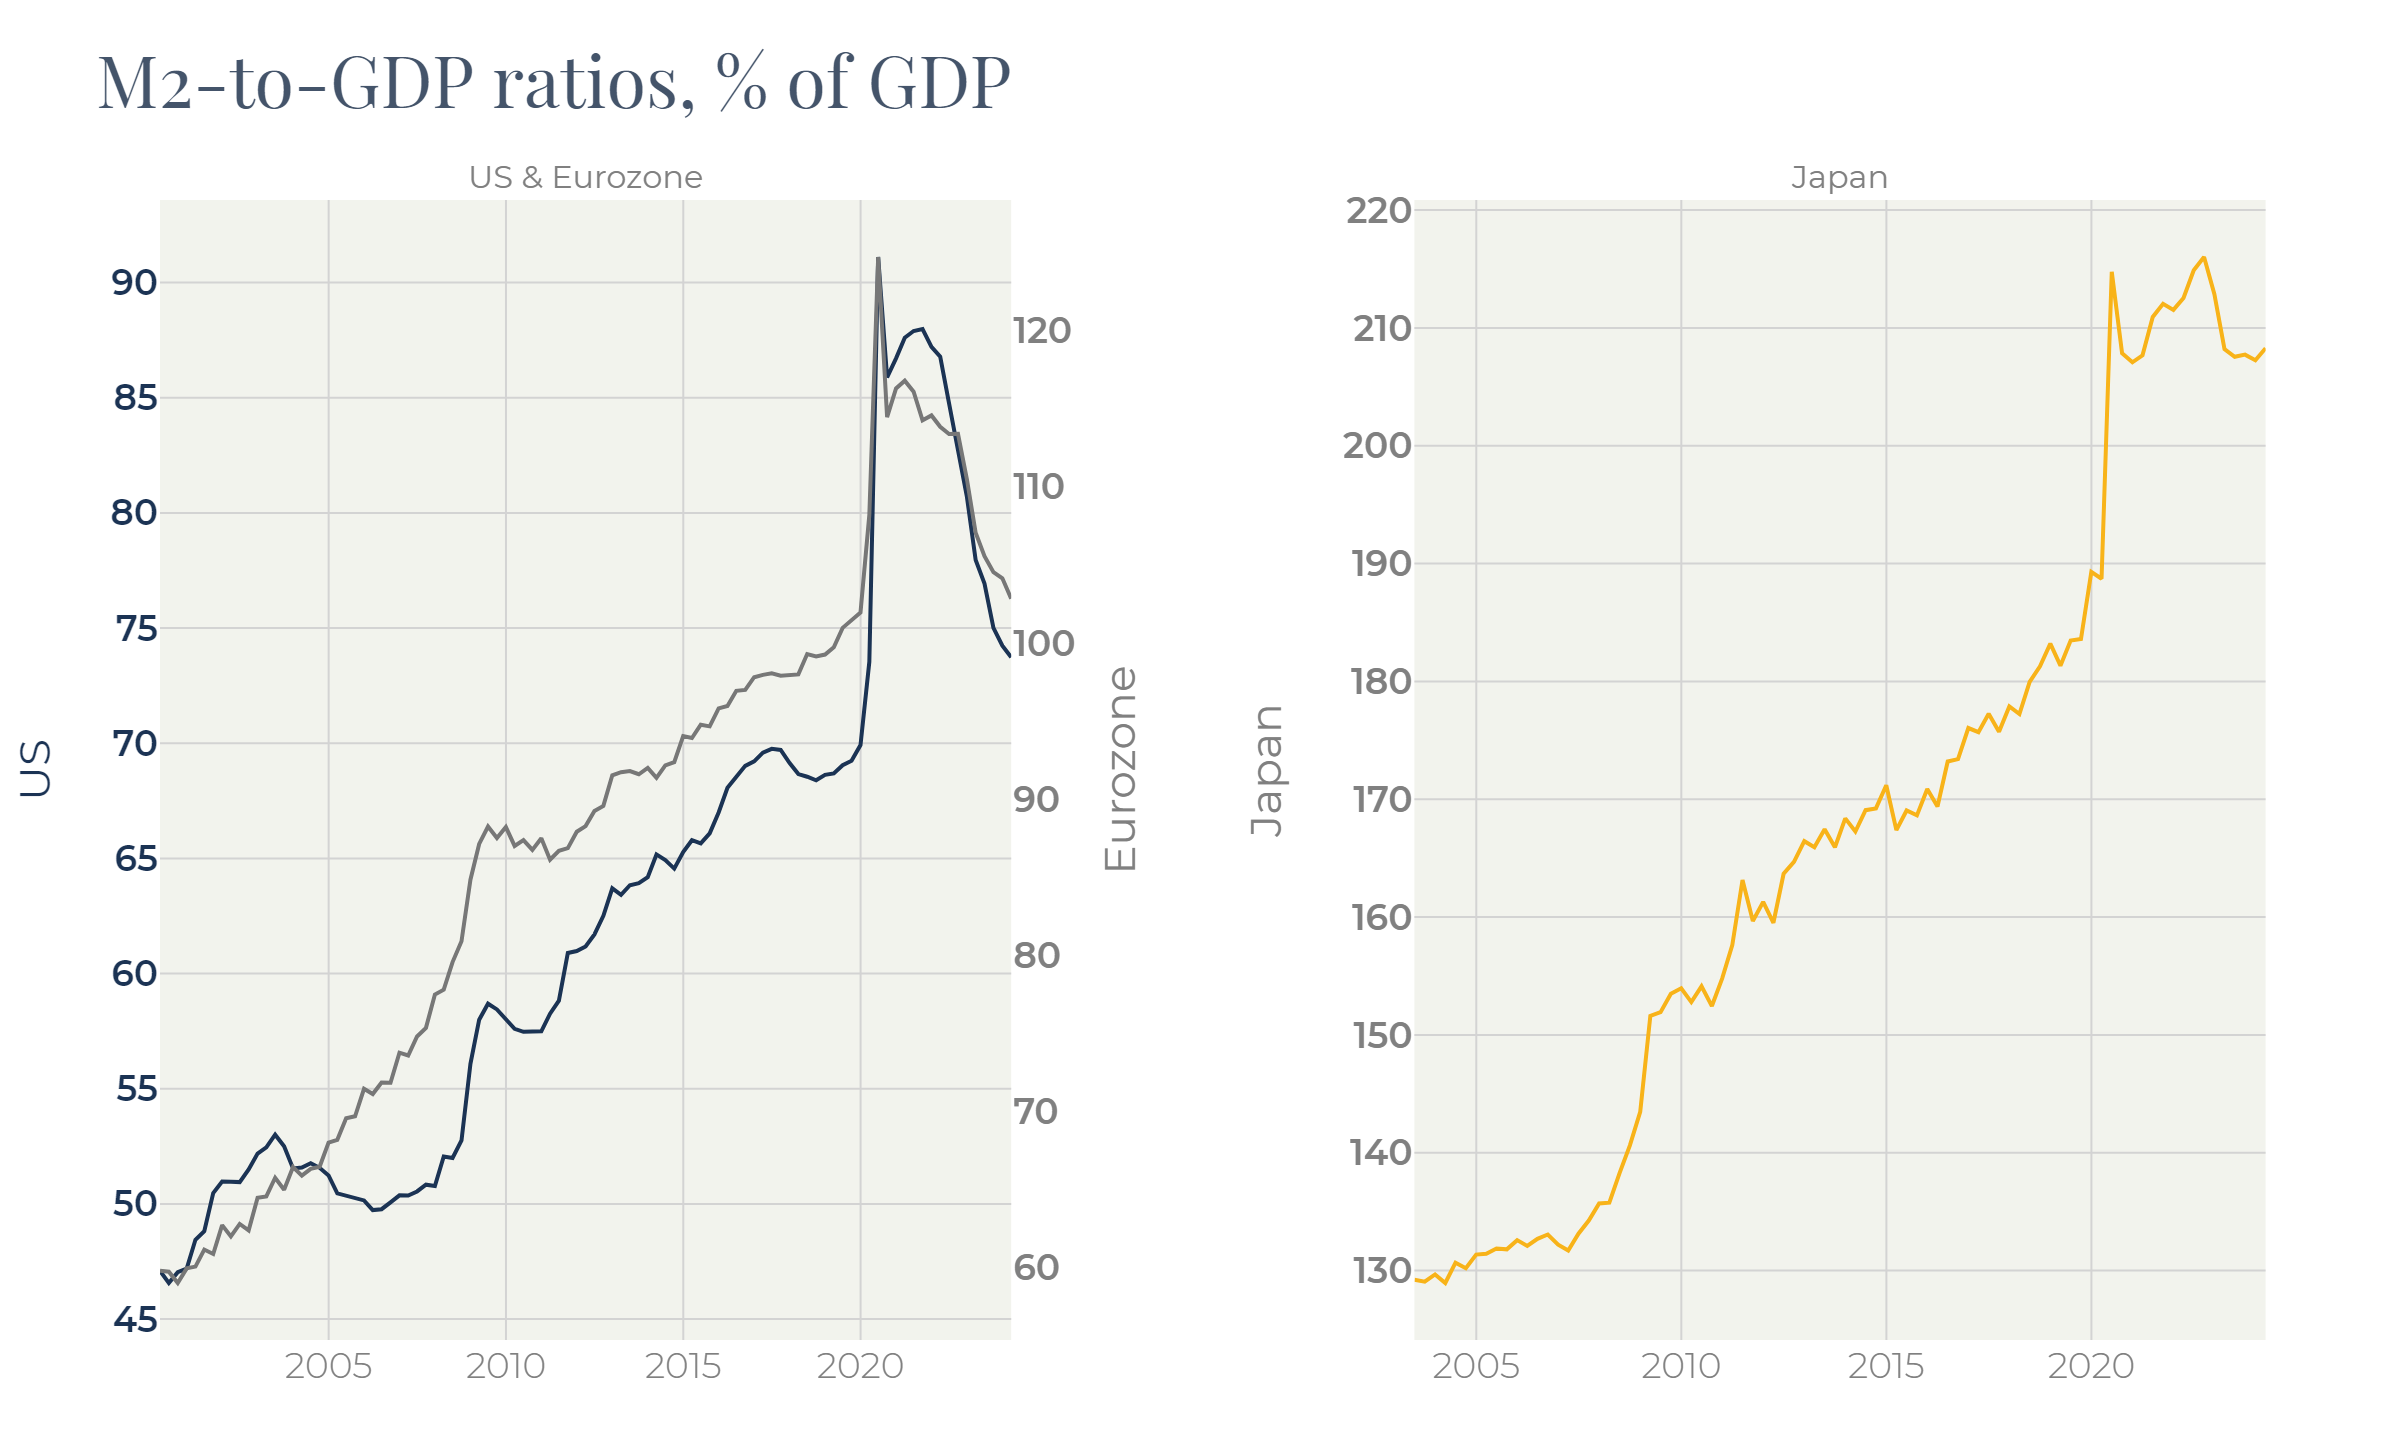
The situation changed with COVID-19. Strict pandemic restrictions and high level of healthcare resulted in a very small death tall compared to Europe and the US. By contrast, monetary stimulus in Japan was much less. M2/GDP ratio rose 10% in Japan versus 20% in Europe and almost 40% in the US:
Figure 11
Inflation spike in Japan was caused primarily by the surged commodities rather than by monetary stimulus.
Unlike US and Europe where inflation rose to circa 10%, the Japanese CPI did not exceed 5% and has been below 3% since November 2023.
Japan’s situation with prices is not only easier, BoJ got one more chance to entrench inflation at the 2% target. For this reason, the BoJ monetary policy is not restrictive at all. It makes small steps towards normalization fearing that an over-restrictive approach will send inflation to the zero level once more (Figure 11).
Another striking difference to the EU & US situation is that BoJ relies much more on controlling the yield curve through purchasing lo bonds rather than setting a key rate. On June 14 the Bank of Japan said it would reduce government bond purchases in a signal of monetary tightening, leaving its policy interest rate unchanged. That marked the start of a new wave of weakening the yen.
Even with the zero level of rates dynamics of major economic activity figures – consumer confidence, housing starts, car sales – show the same dynamics as in the US or Europe. Manufacturing activity is muted because of low demand for durables. Local consumption suffers from the yen devaluation.
Maintaining low short rates, the Bank of Japan intends to prevent inflation dropping back.
Figure 12
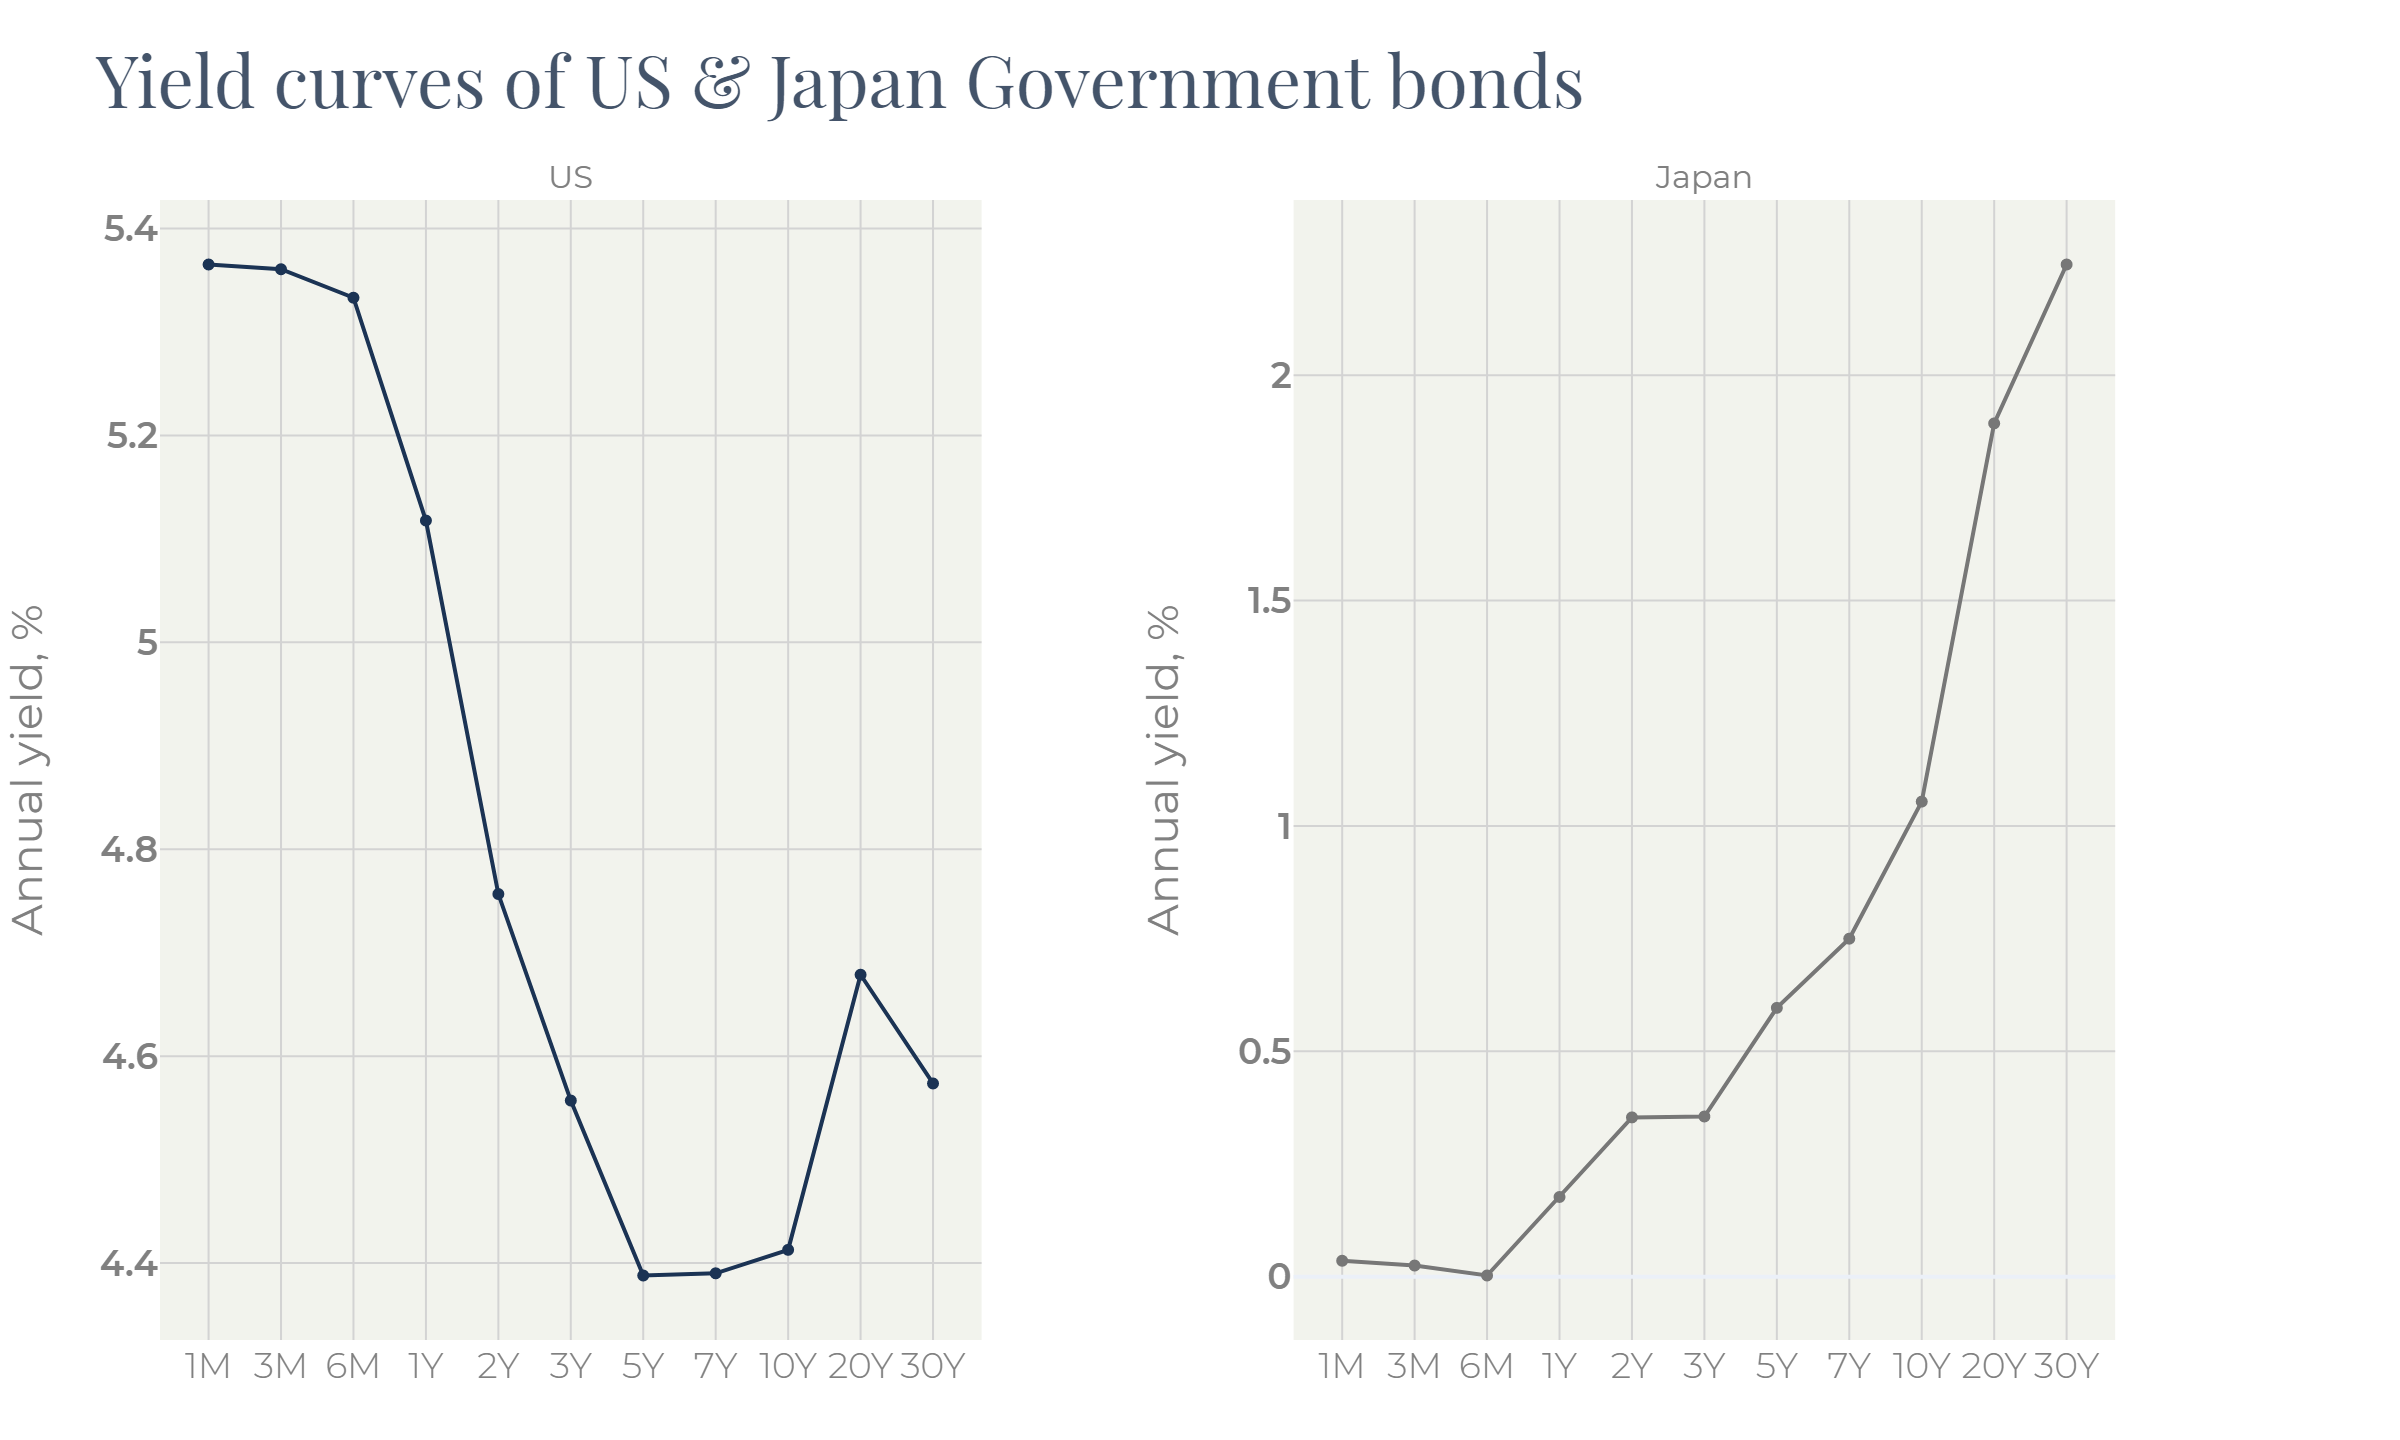
This cautious and in a way unique approach led to the imbalance between the local and the global markets. The CPI readings for May are 3.2% for the US and 2.8% for Japan: the difference is not so impressive. The difference in the bond yield curves, though, is much more substantial (Figure 12).
The long story of a direct controlling the bond market washed out independent investors and isolated the fixed income market of Japan. That allowed BoJ to use it as a monetary tool and resulted in disproportionally expensive bonds in the end. Now, with the new hope for returning inflation to 2%, the BoJ started to loosen its grip. Without moving bond yields closer to inflation, Japan risks to spiking an inflation spiral.
But, doing so, the BoJ has formed a downtrend in the bond market which is far from being accomplished. Indeed, with a long-term inflation target of circa 2%, the 10-year yield should be at least 2.5%. This implies 150bp of upside for the 10Y bond yield.
In this situation bond investors prefer the US bonds that give returns well above inflation and where the price fall has already happened.
Figure 13
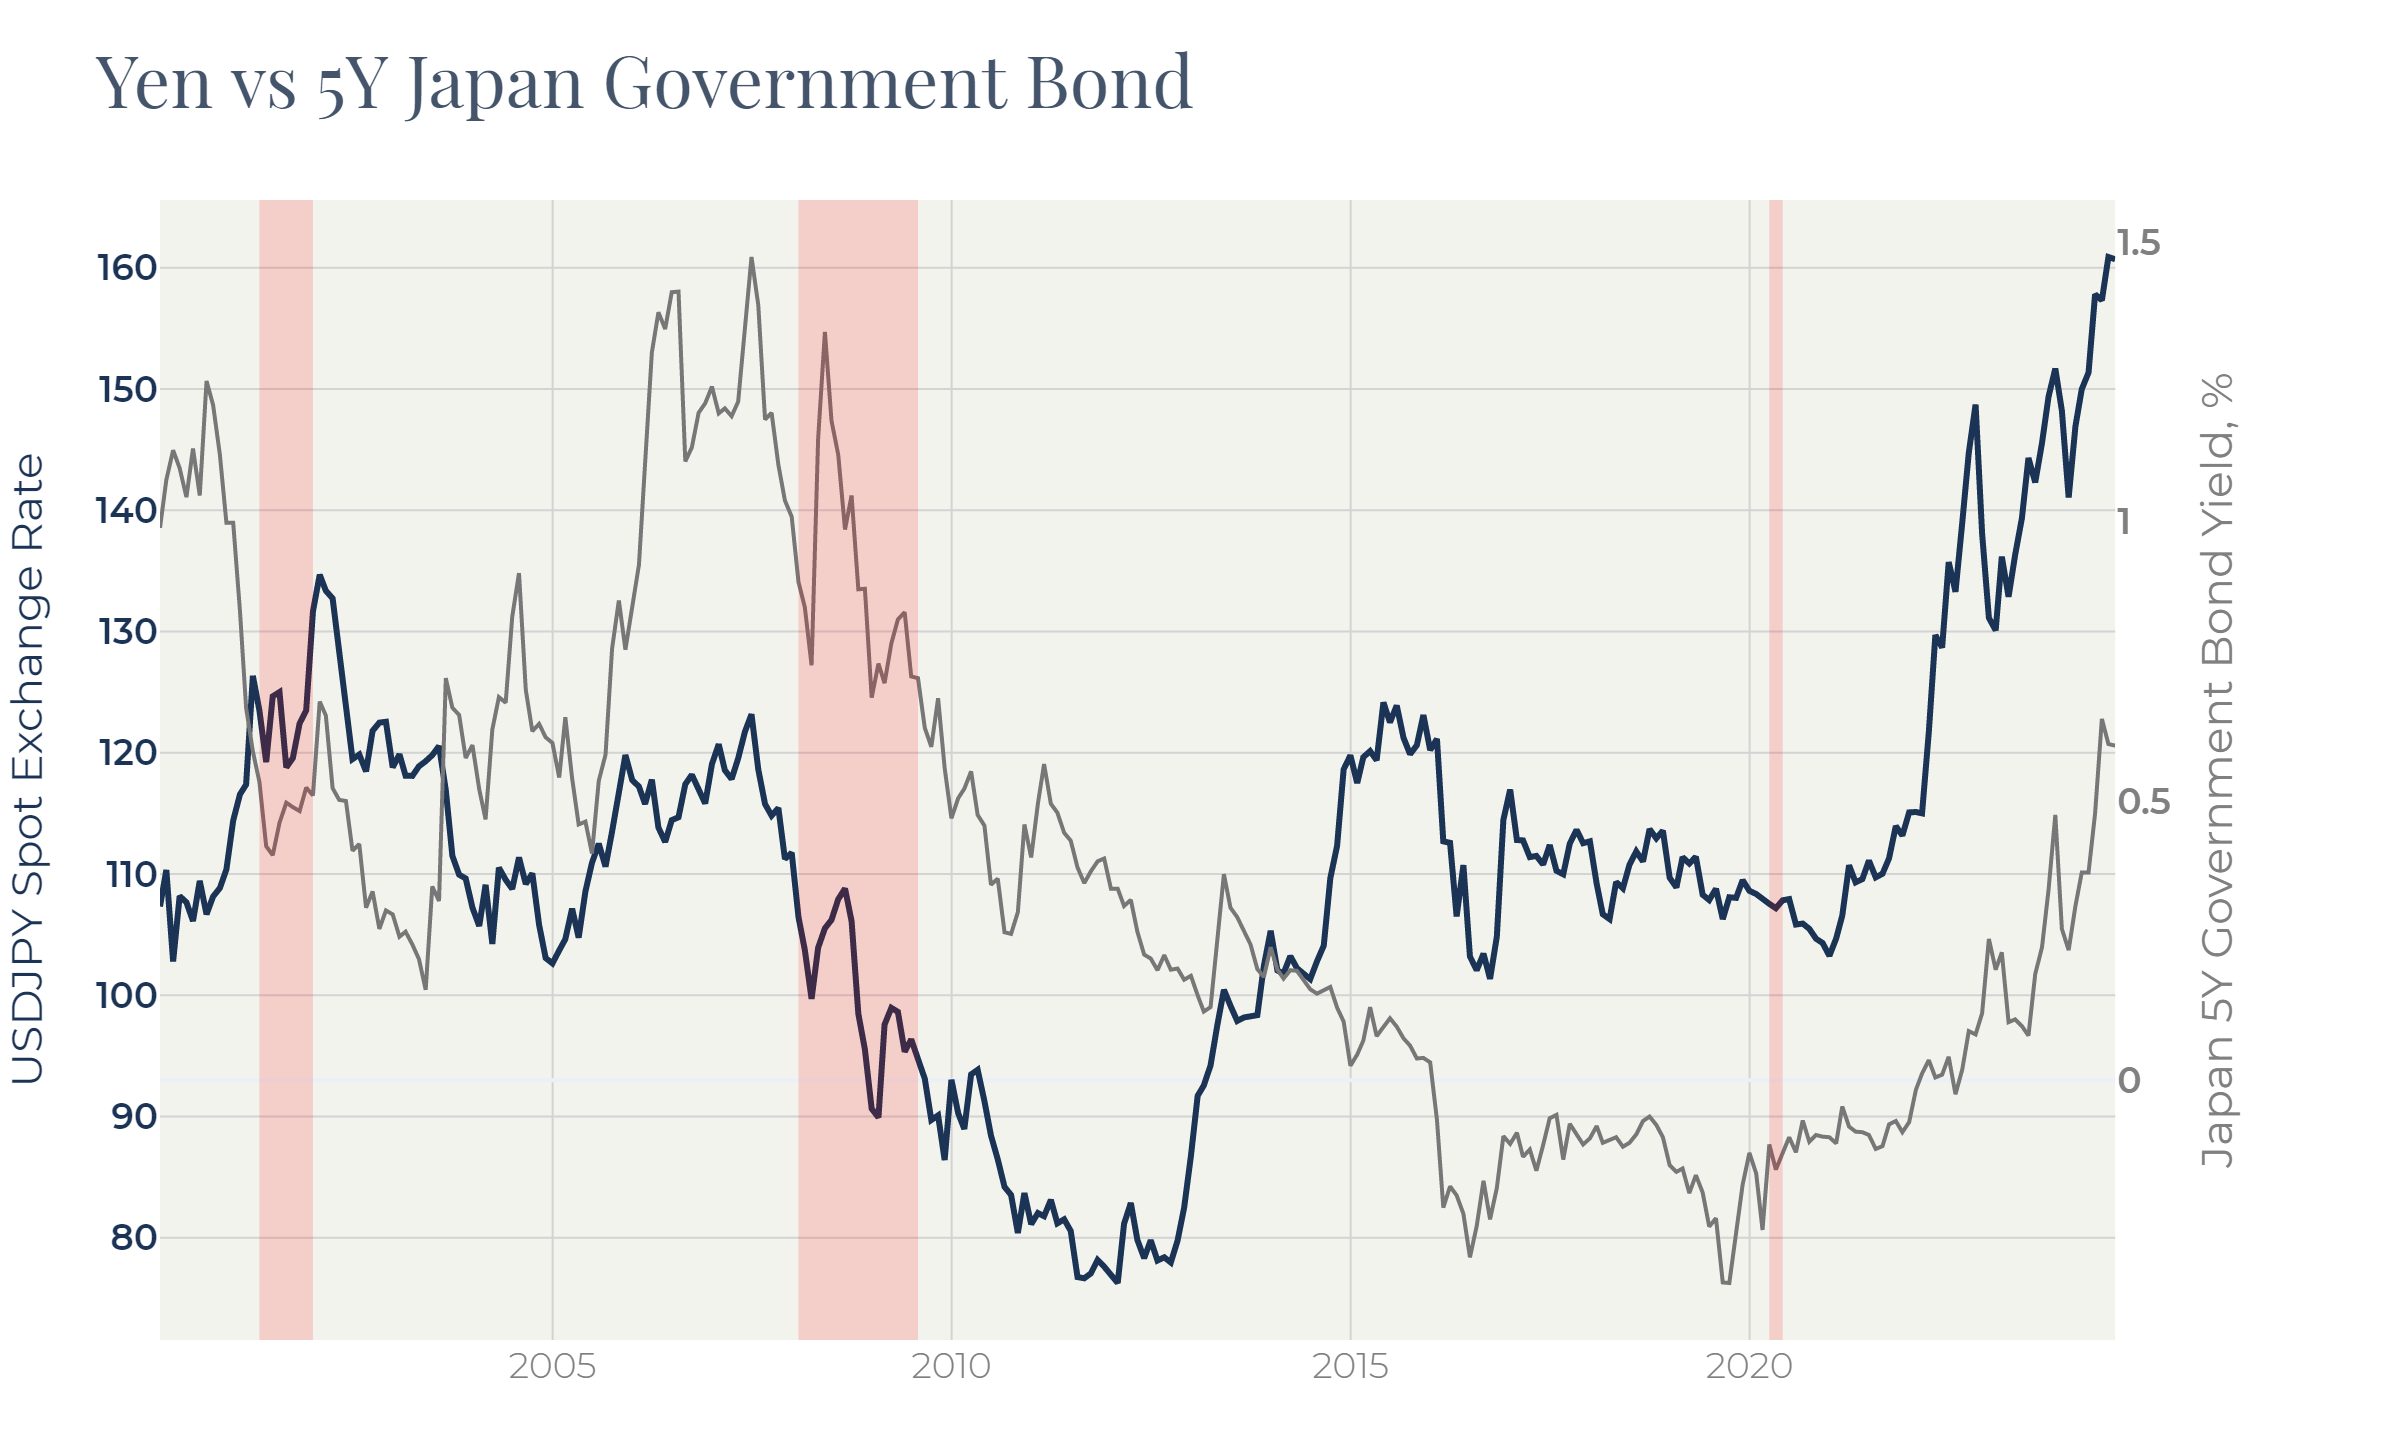
Bonds traditionally correlate to currencies. Selling local bonds and reallocating assets to foreign markets, investors put pressure on the yen lowering its cross-rate (Figure 13).
Because of that the yen turned from then one-of-most-expensive currencies in the world to a quite cheap one. Figure 14 demonstrates the “expensiveness” of the yen calculated as a ratio between its nominal rate and the cross-rate used by IMF for its GDP PPP calculations1 . By 2024 this ratio has fallen to almost 60% from the pre-pandemic near-to-parity value.
Figure 14
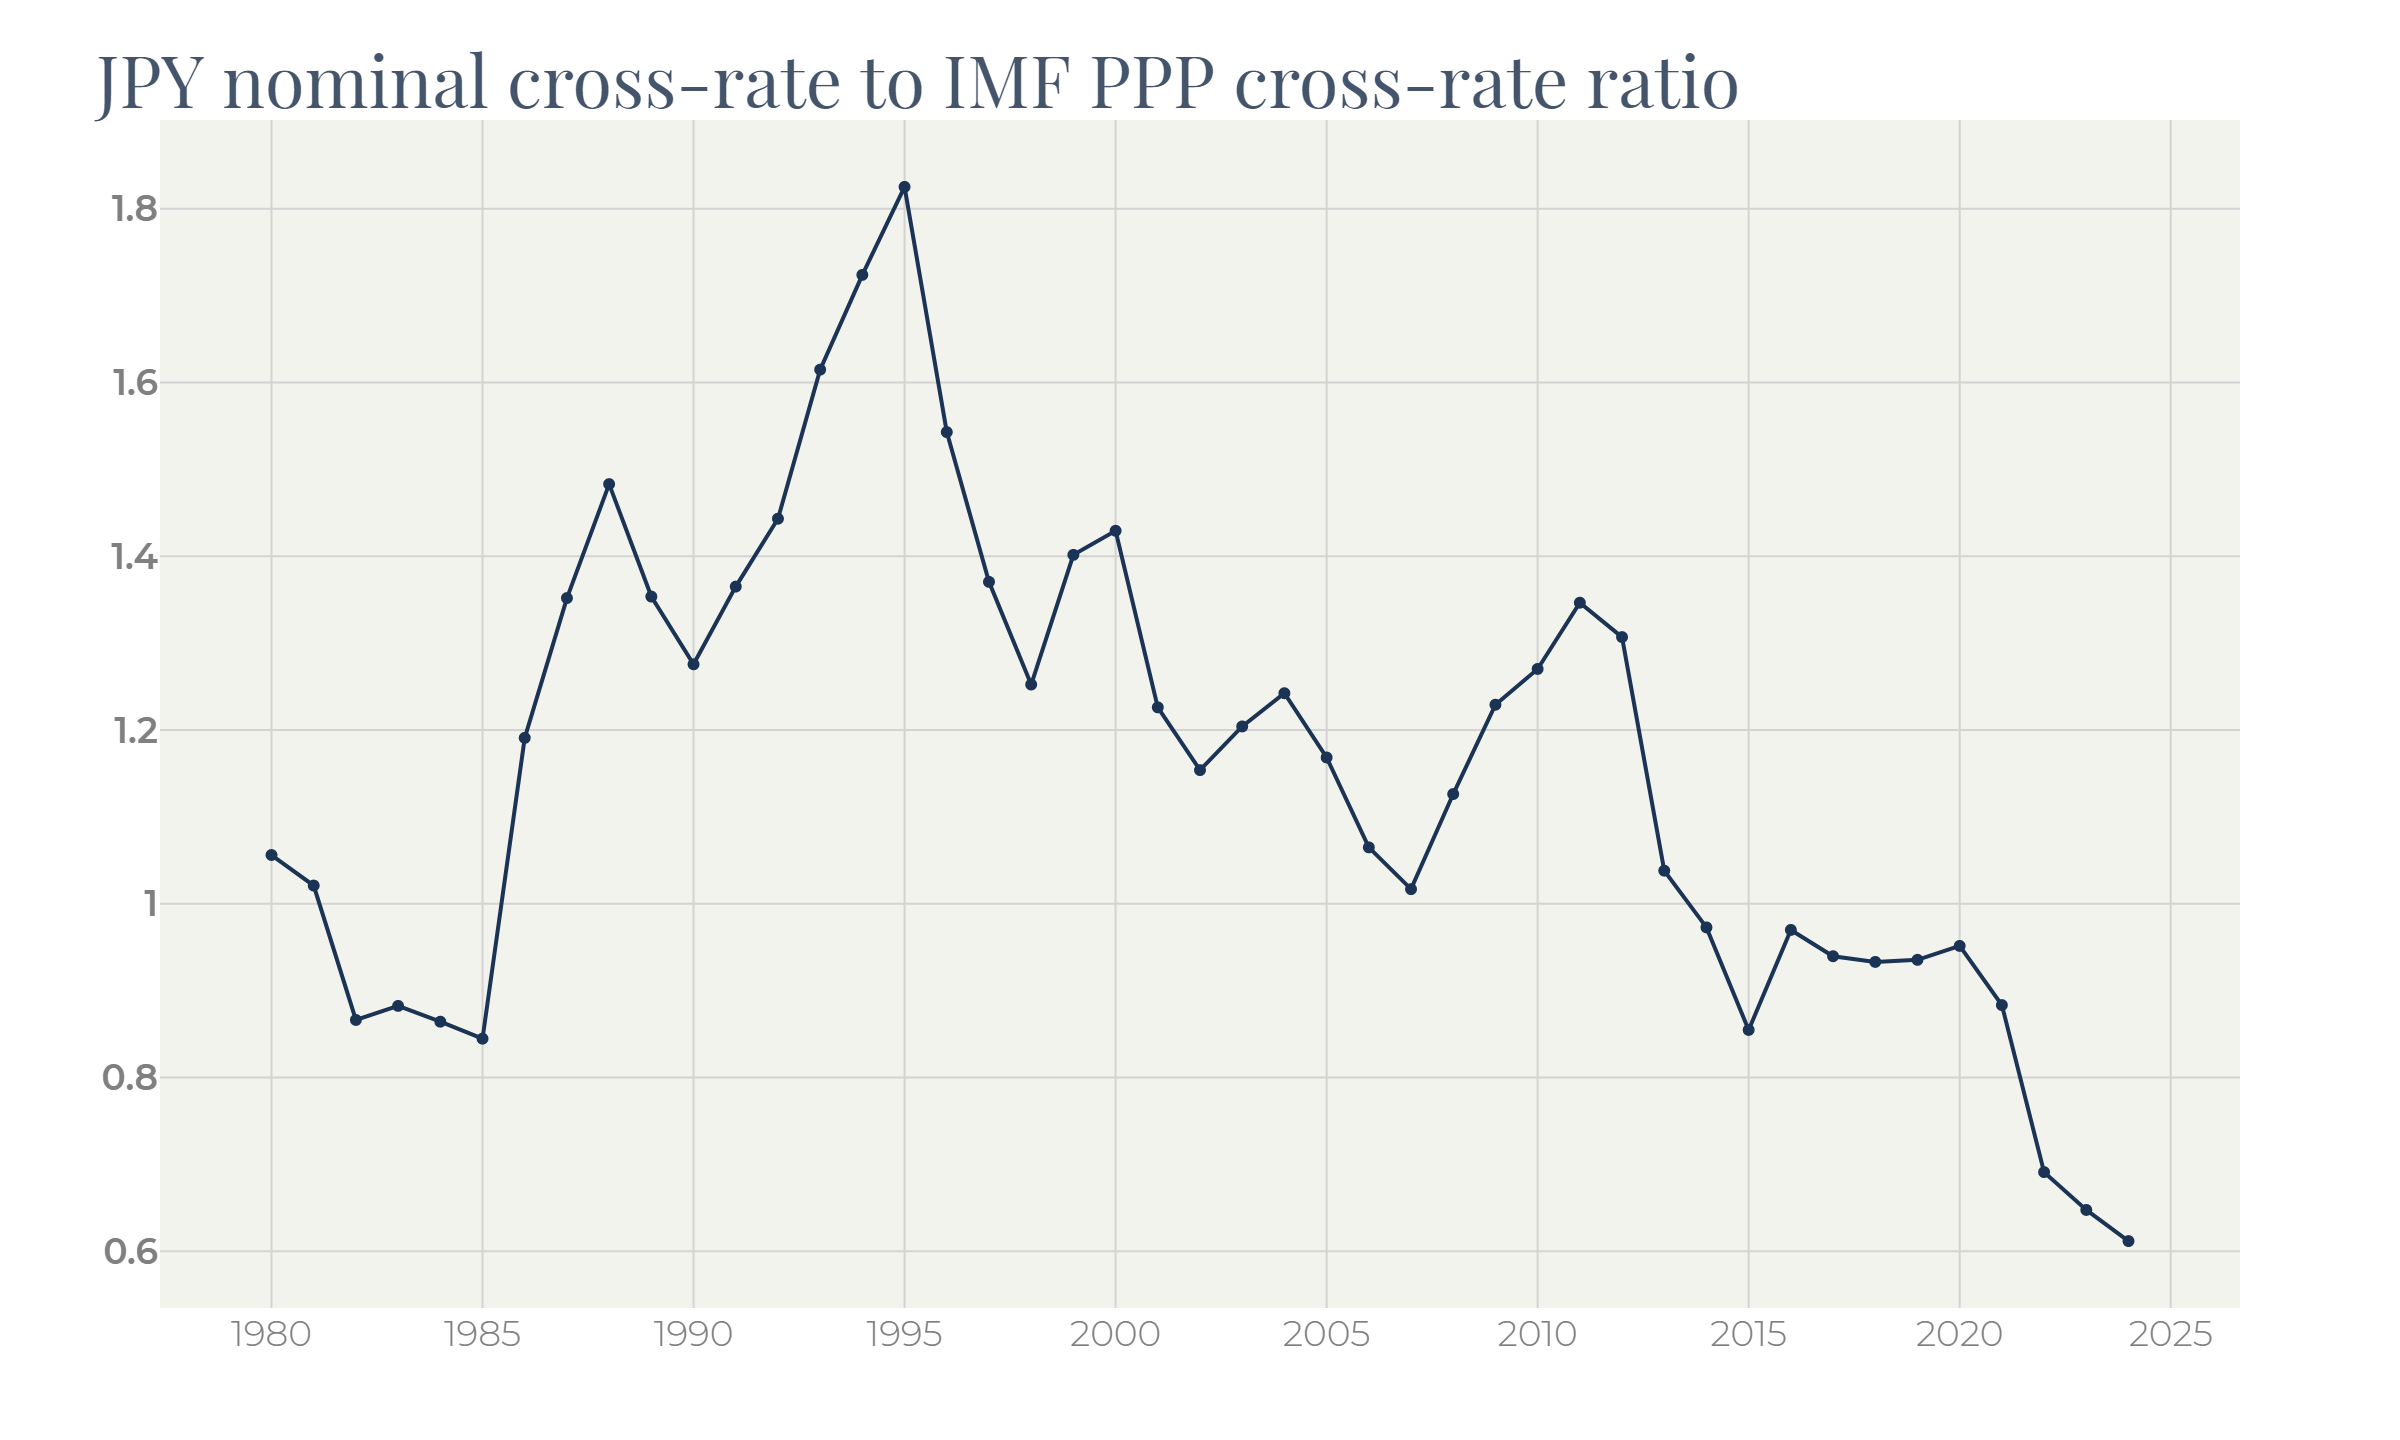
Such a ratio is typical of emerging markets: in their case the PPP GDP is generally higher than the nominal value. For developed markets it is a very rare case.
The fact that the yen has devalued against the dollar on the back of much higher inflation in the US contradicts the basics of the economic theory.
The explanation for this phenomenon lies around the weak relation between the currency rate and the trade balance on one hand, and long historical overvaluation in the bond market on the other.
In this review we have not covered the issue of high Japan debt burden. To deal with that, we would highlight three possible scenarios for the Japanese economy:
· BoJ succeeds in stabilizing inflation near the 2% level,
· Inflation reverts to 0 as it did after 2008 and 2014 spikes,
· Too soft monetary policy results in a new inflation spike and forces BoJ to tighten its approach like the Fed and the ECB did.
Current situation of negative real rates is comfortable for Japanese finances. The budget is benefiting from higher tax collection on the back of elevated inflation paying the same low interest on its debt. In the first two cases this benefit goes off with time: through elevating bond yields in the first case or through a natural returning to a condition the Japanese economy was over 20 years prior the pandemic.
The third scenario can be dangerous for Japan. If authorities are forced to significantly toughen their policy and to send bond yields above inflation the government interest payments will surge. Each 100bp of a rate hike will require additional payments of 2.7% of GDP. The budget can hardly bear such a burden, the only possible source in this case can be an extra monetary issuance.
It is worth highlighting that Japan has quite a comfortable debt term structure:
Figure 15
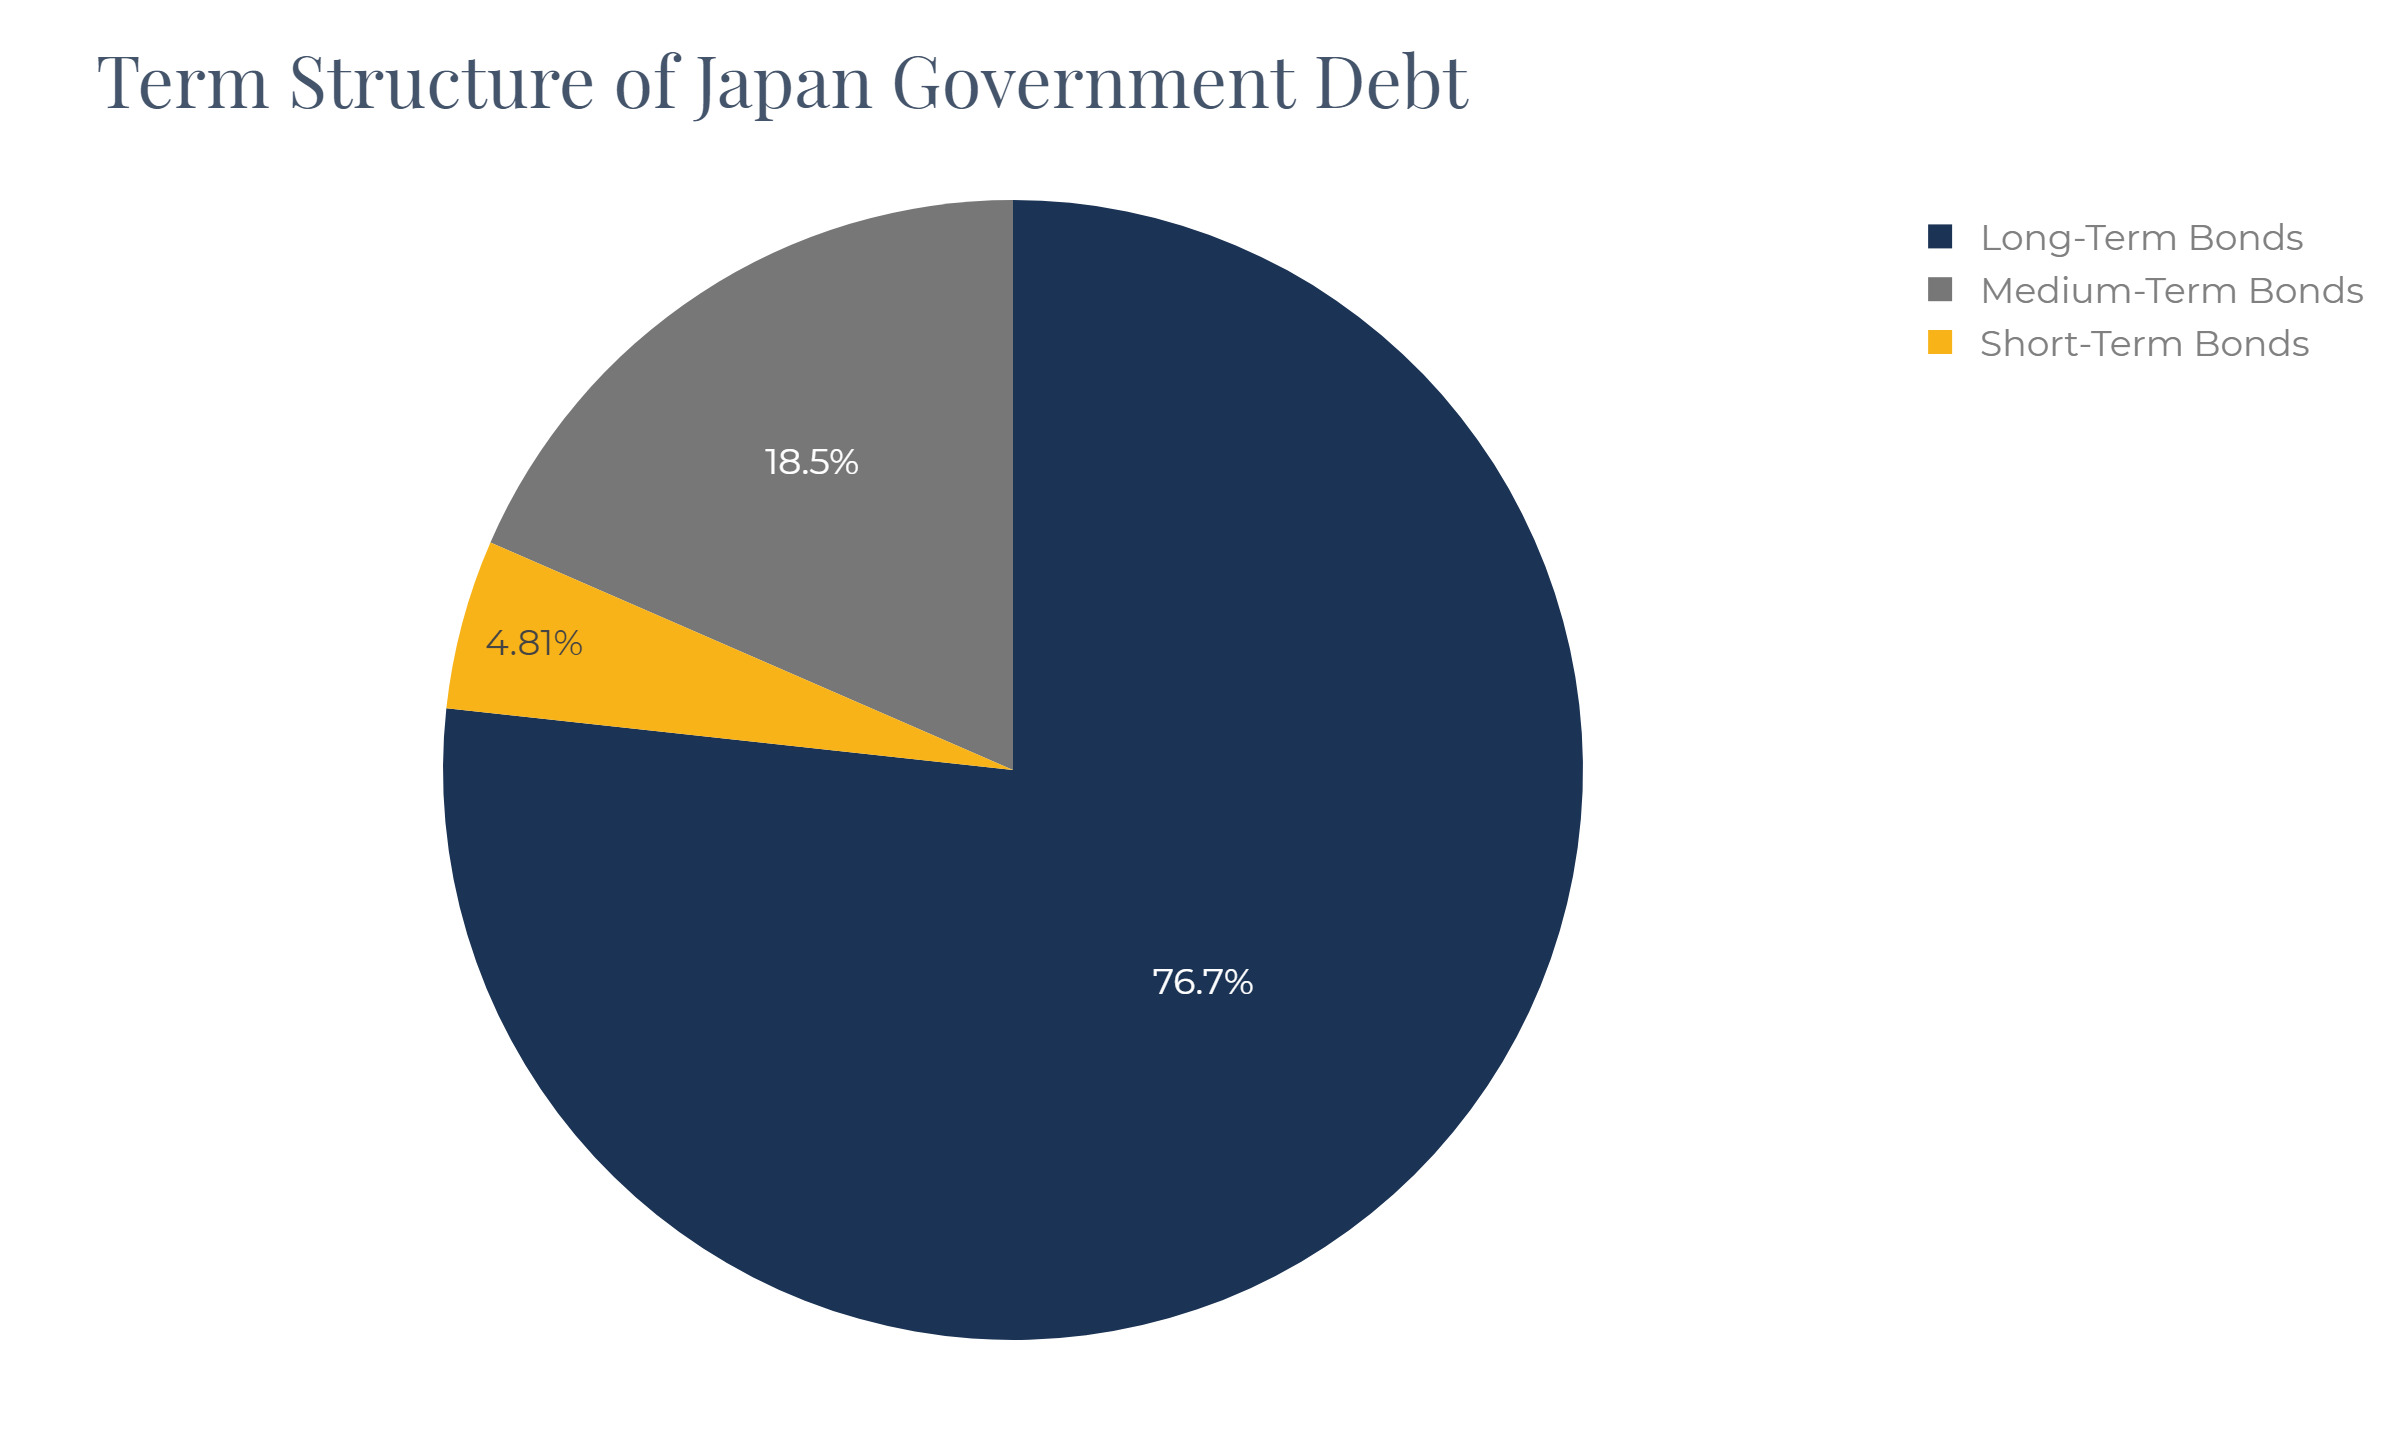
By contrast, the US debt is much more concentrated in the short end of the curve. Therefore, the Japanese budget is much less sensitive to the interest rate fluctuations in the short run.
On the other hand, the inflation behavior in Japan well correlates to global trends. Monetary stimulus in Japan was moderate, and a slow cooling off is taking place now. So, a catastrophic scenario, although remaining possible, still does not represent much risk for the country.
Figure 16
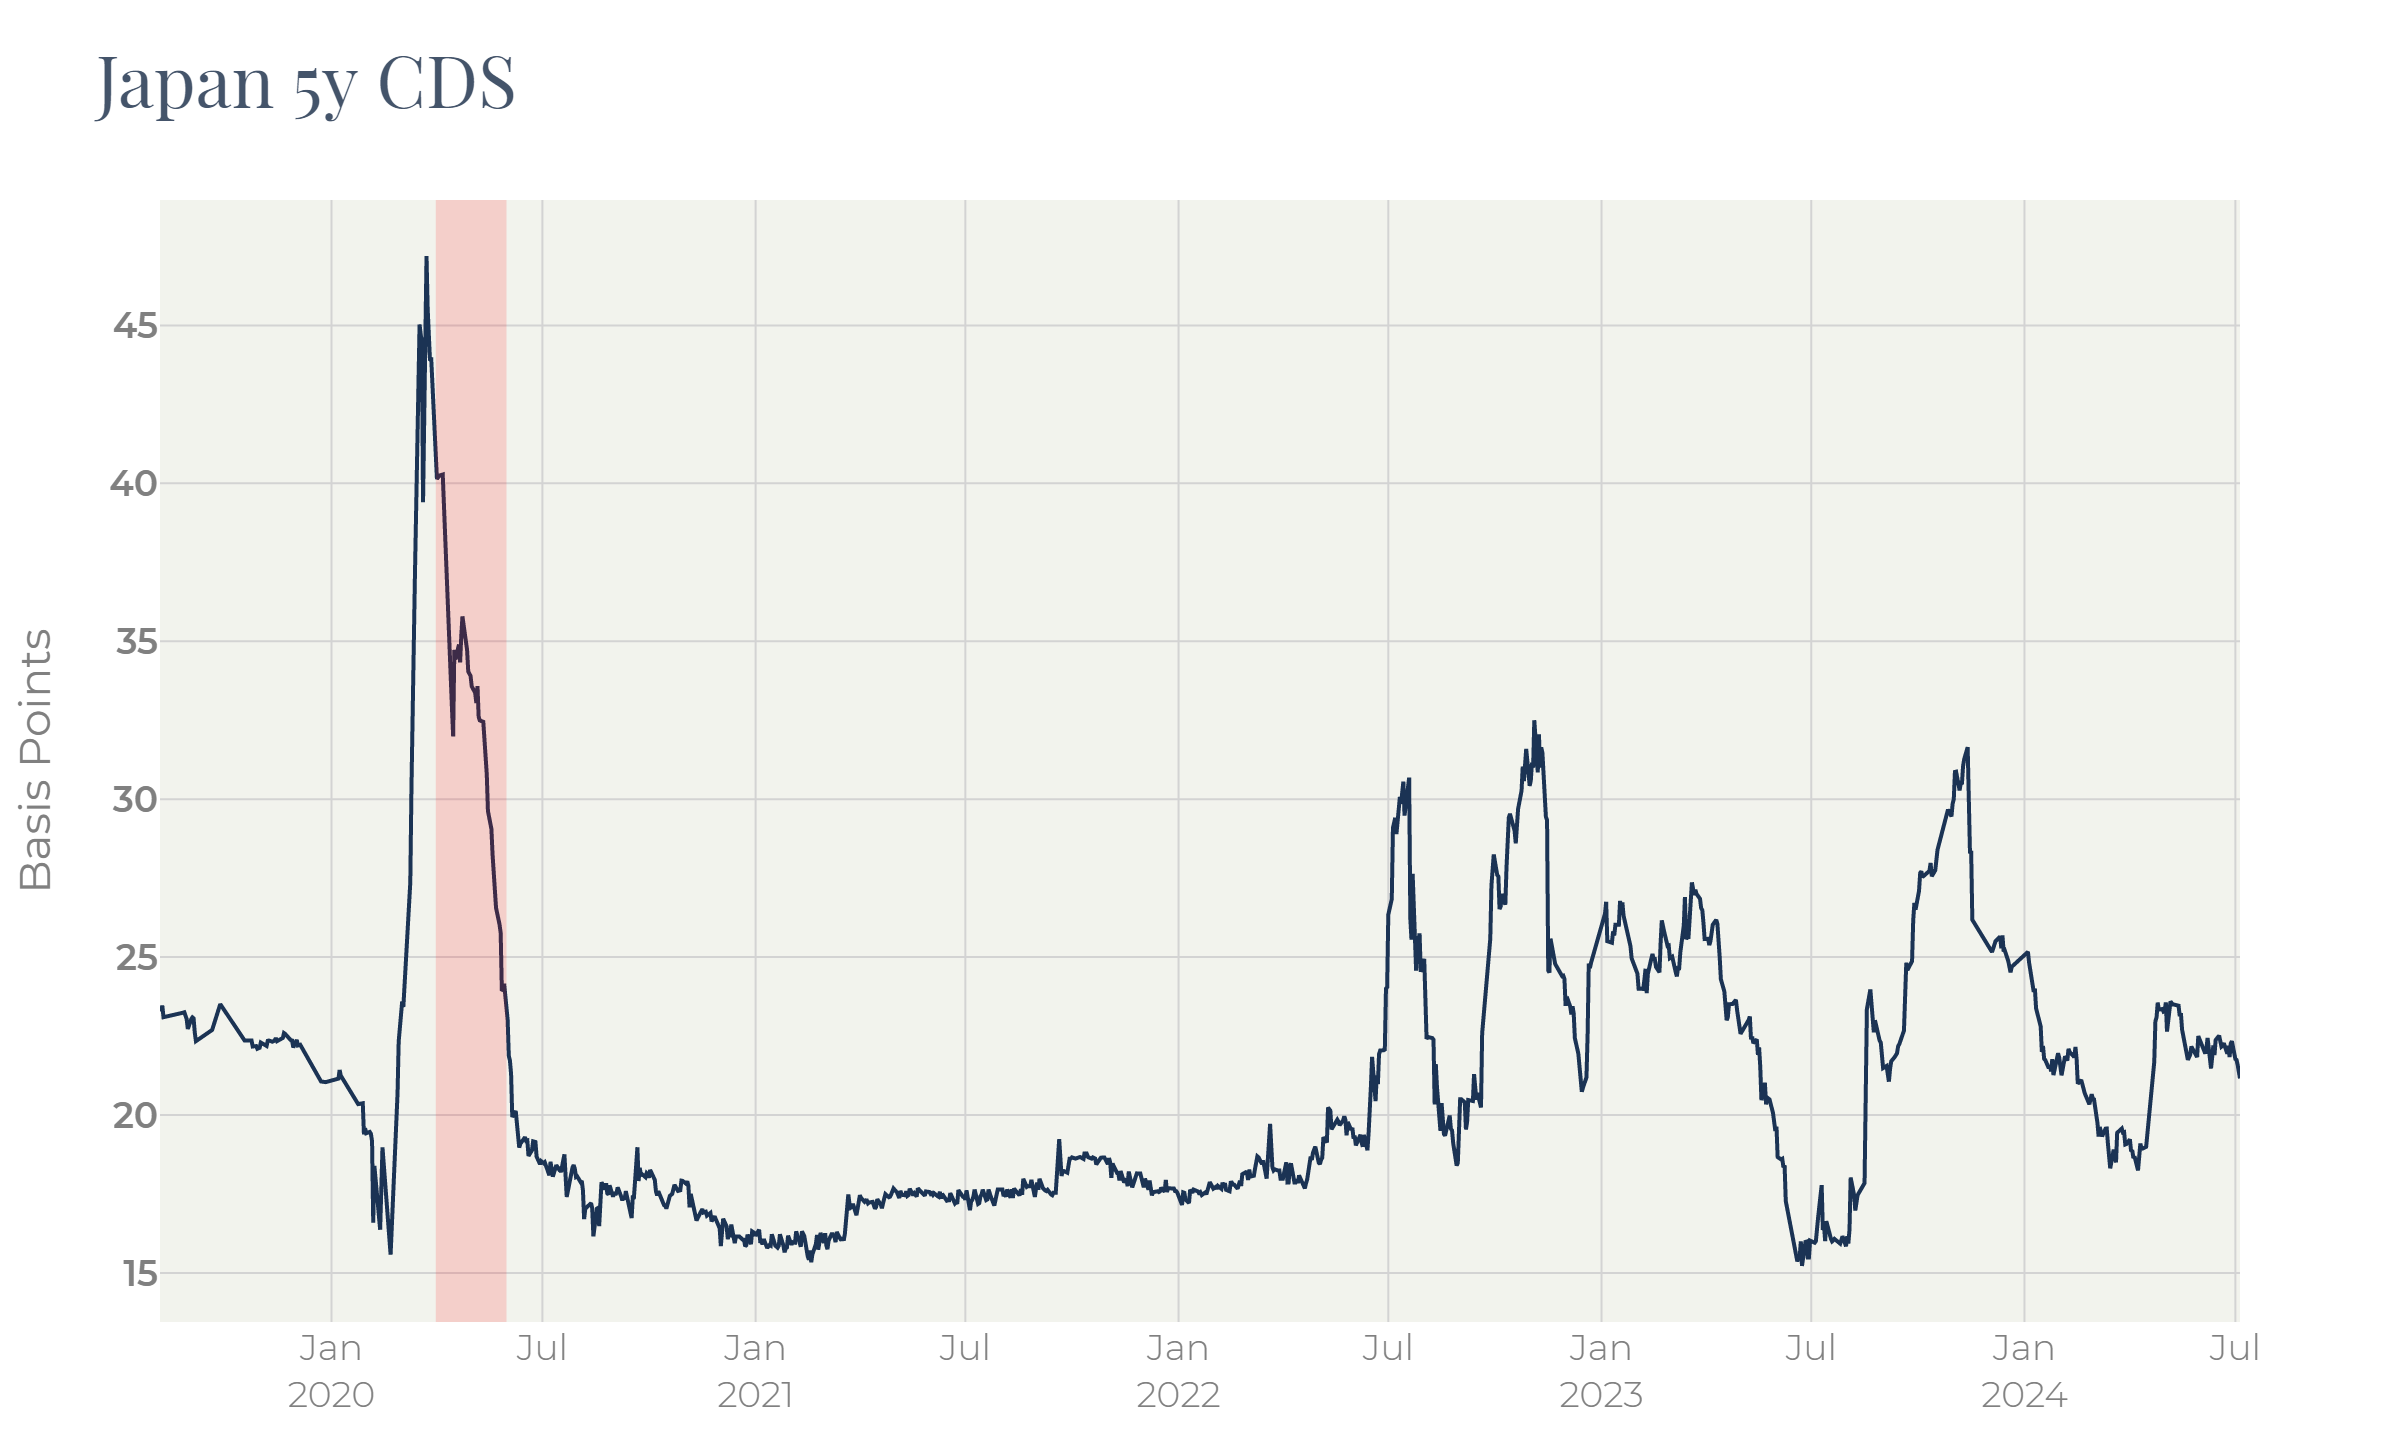
5Y Japan CDS is fluctuating in a narrow range between 20 and 40bp showing that investors consider the default risk to be very small (Figure 16). By contrast, the “higher for longer” narrative has become widespread. With that said, the only conclusion we can draw is that rising rates on the back of elevated inflation is a dominant reason for currency weakness.
If an equilibrium for the long part of the yield curve stands in the range of 2—3%, the potential yield upside is 1—2% which transforms into price loss of 10—30% depending on what part of the curve we take.
The Japanese bond market is not open for global investors, so the local ones simply cannot find buyers for their bonds. Buyers, though, can invest in the local bond market if the local currency is cheap enough. In this case a future currency revaluation can compensate for losses on bonds.
Figure 17
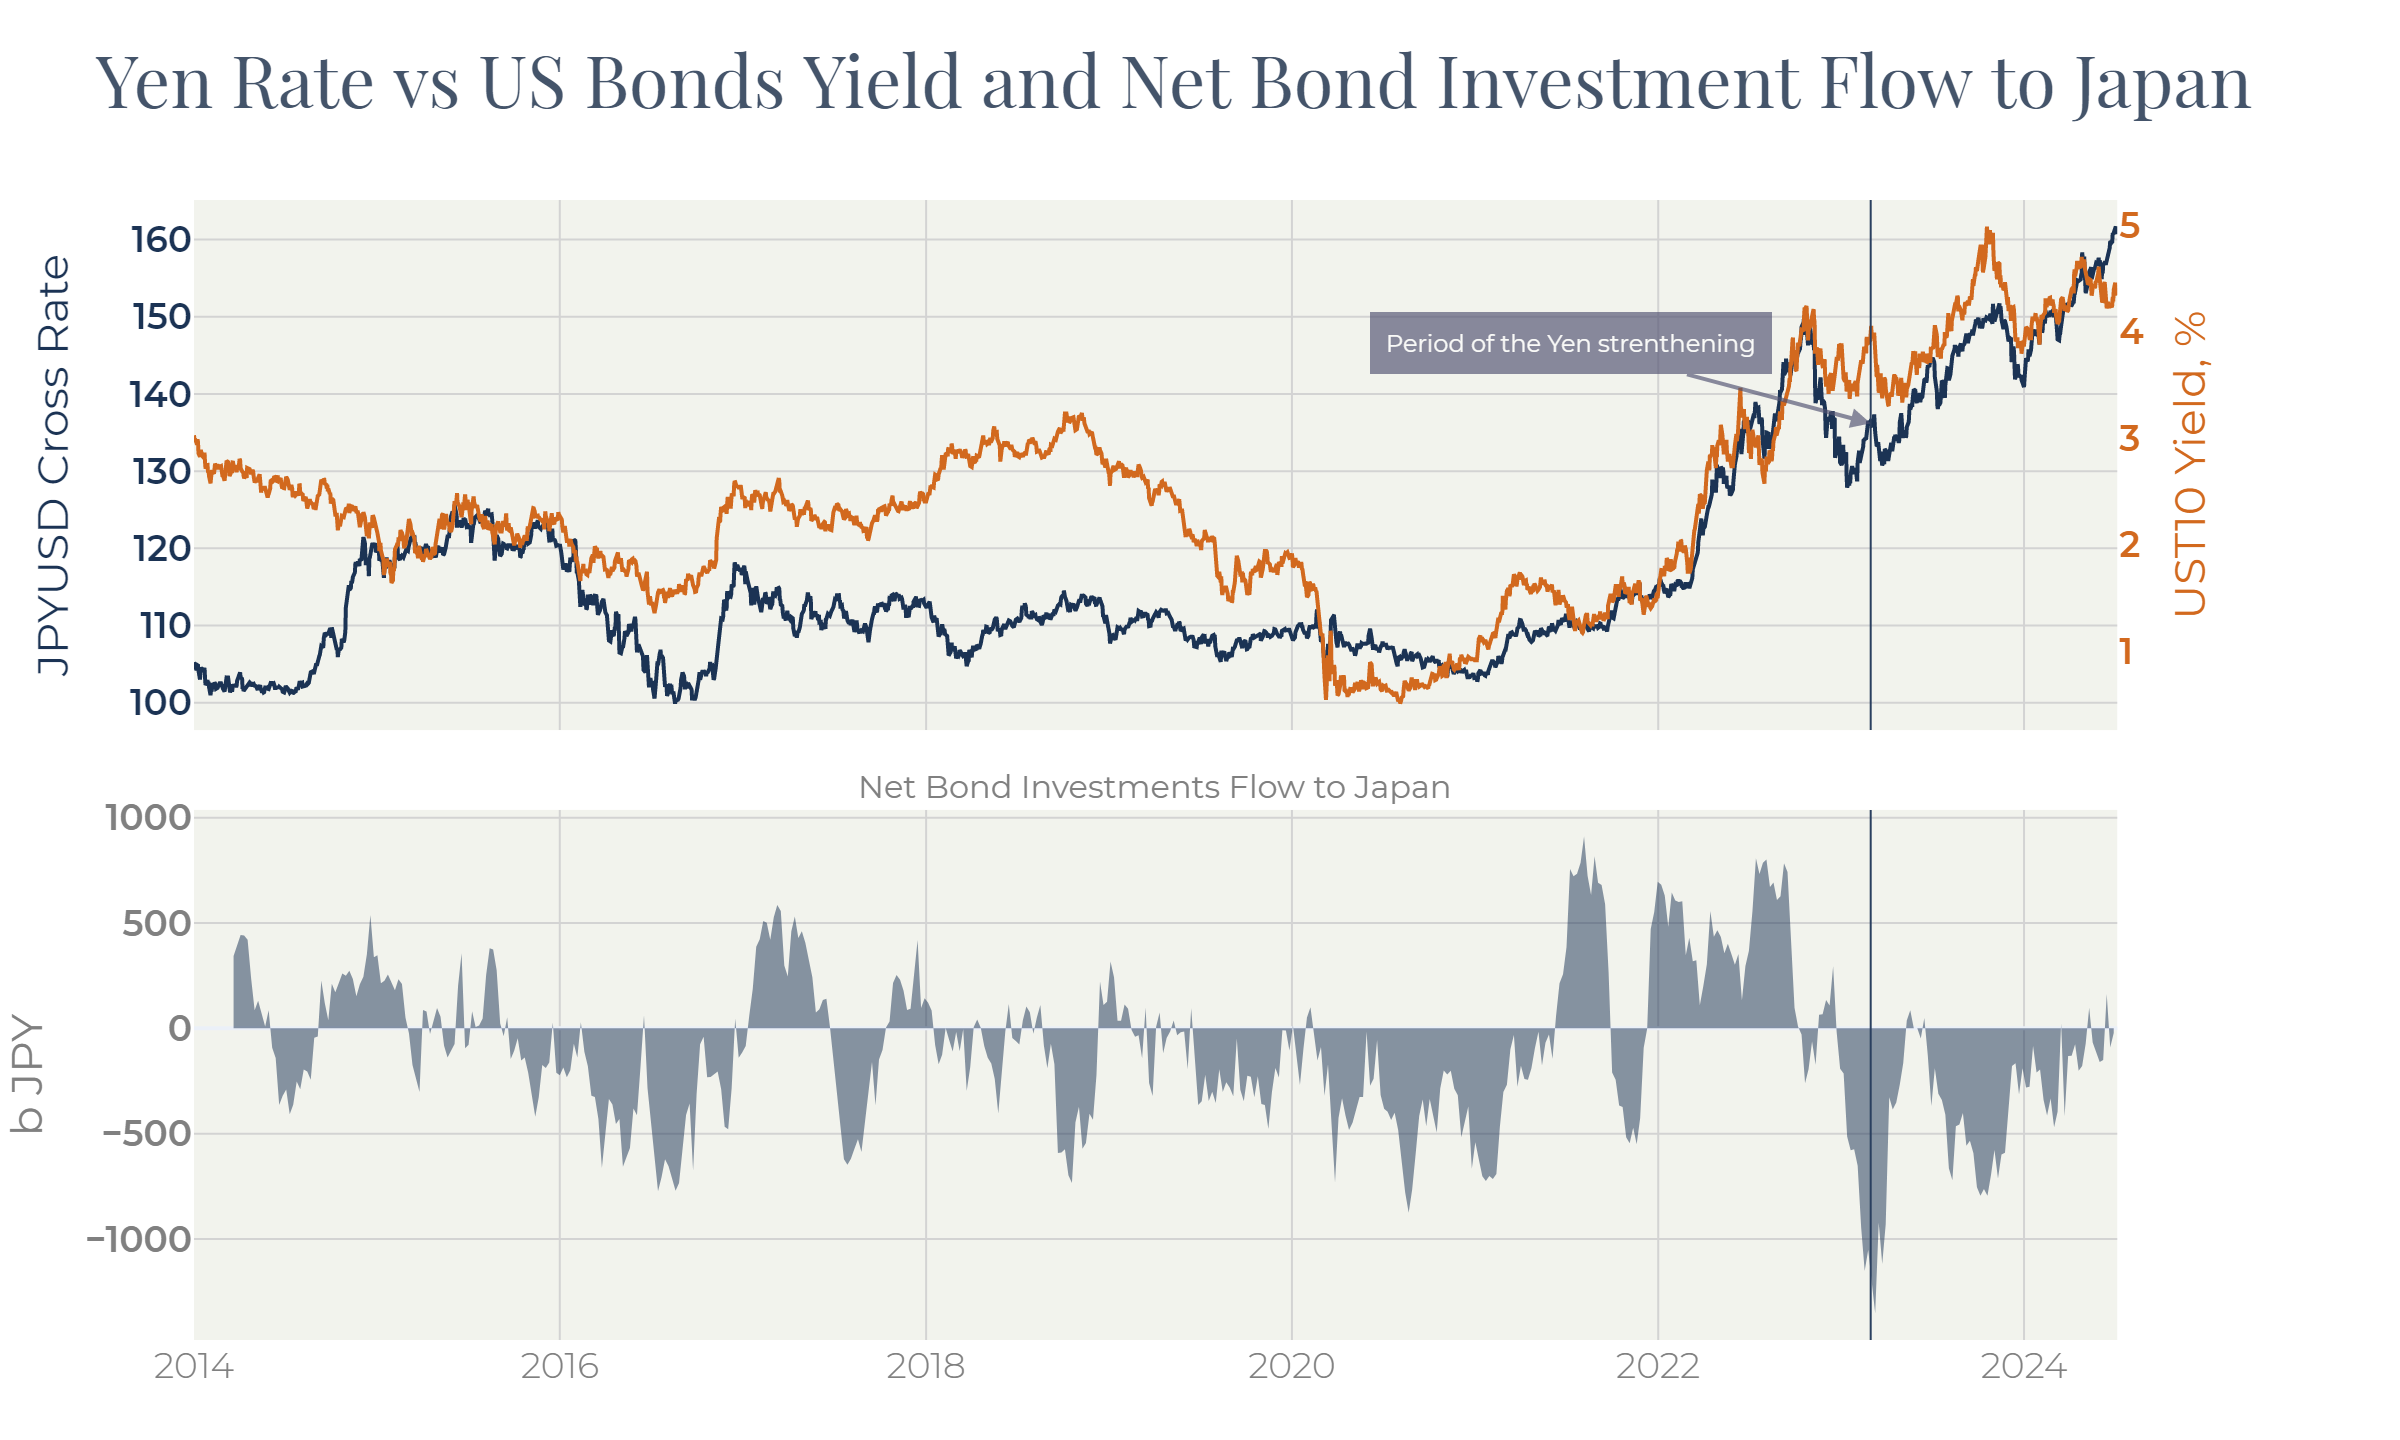
As Figure 17 shows, the yen correlates to the US Treasury bond yields as well. The higher the US bond yields are the more investors are eager to reallocate their funds from low-yielding local bonds. In case the yen strengthens allowing them to sell local bonds without significant losses, like it was in Q1 2023, the outflow from the Japanese fixed income market surges.
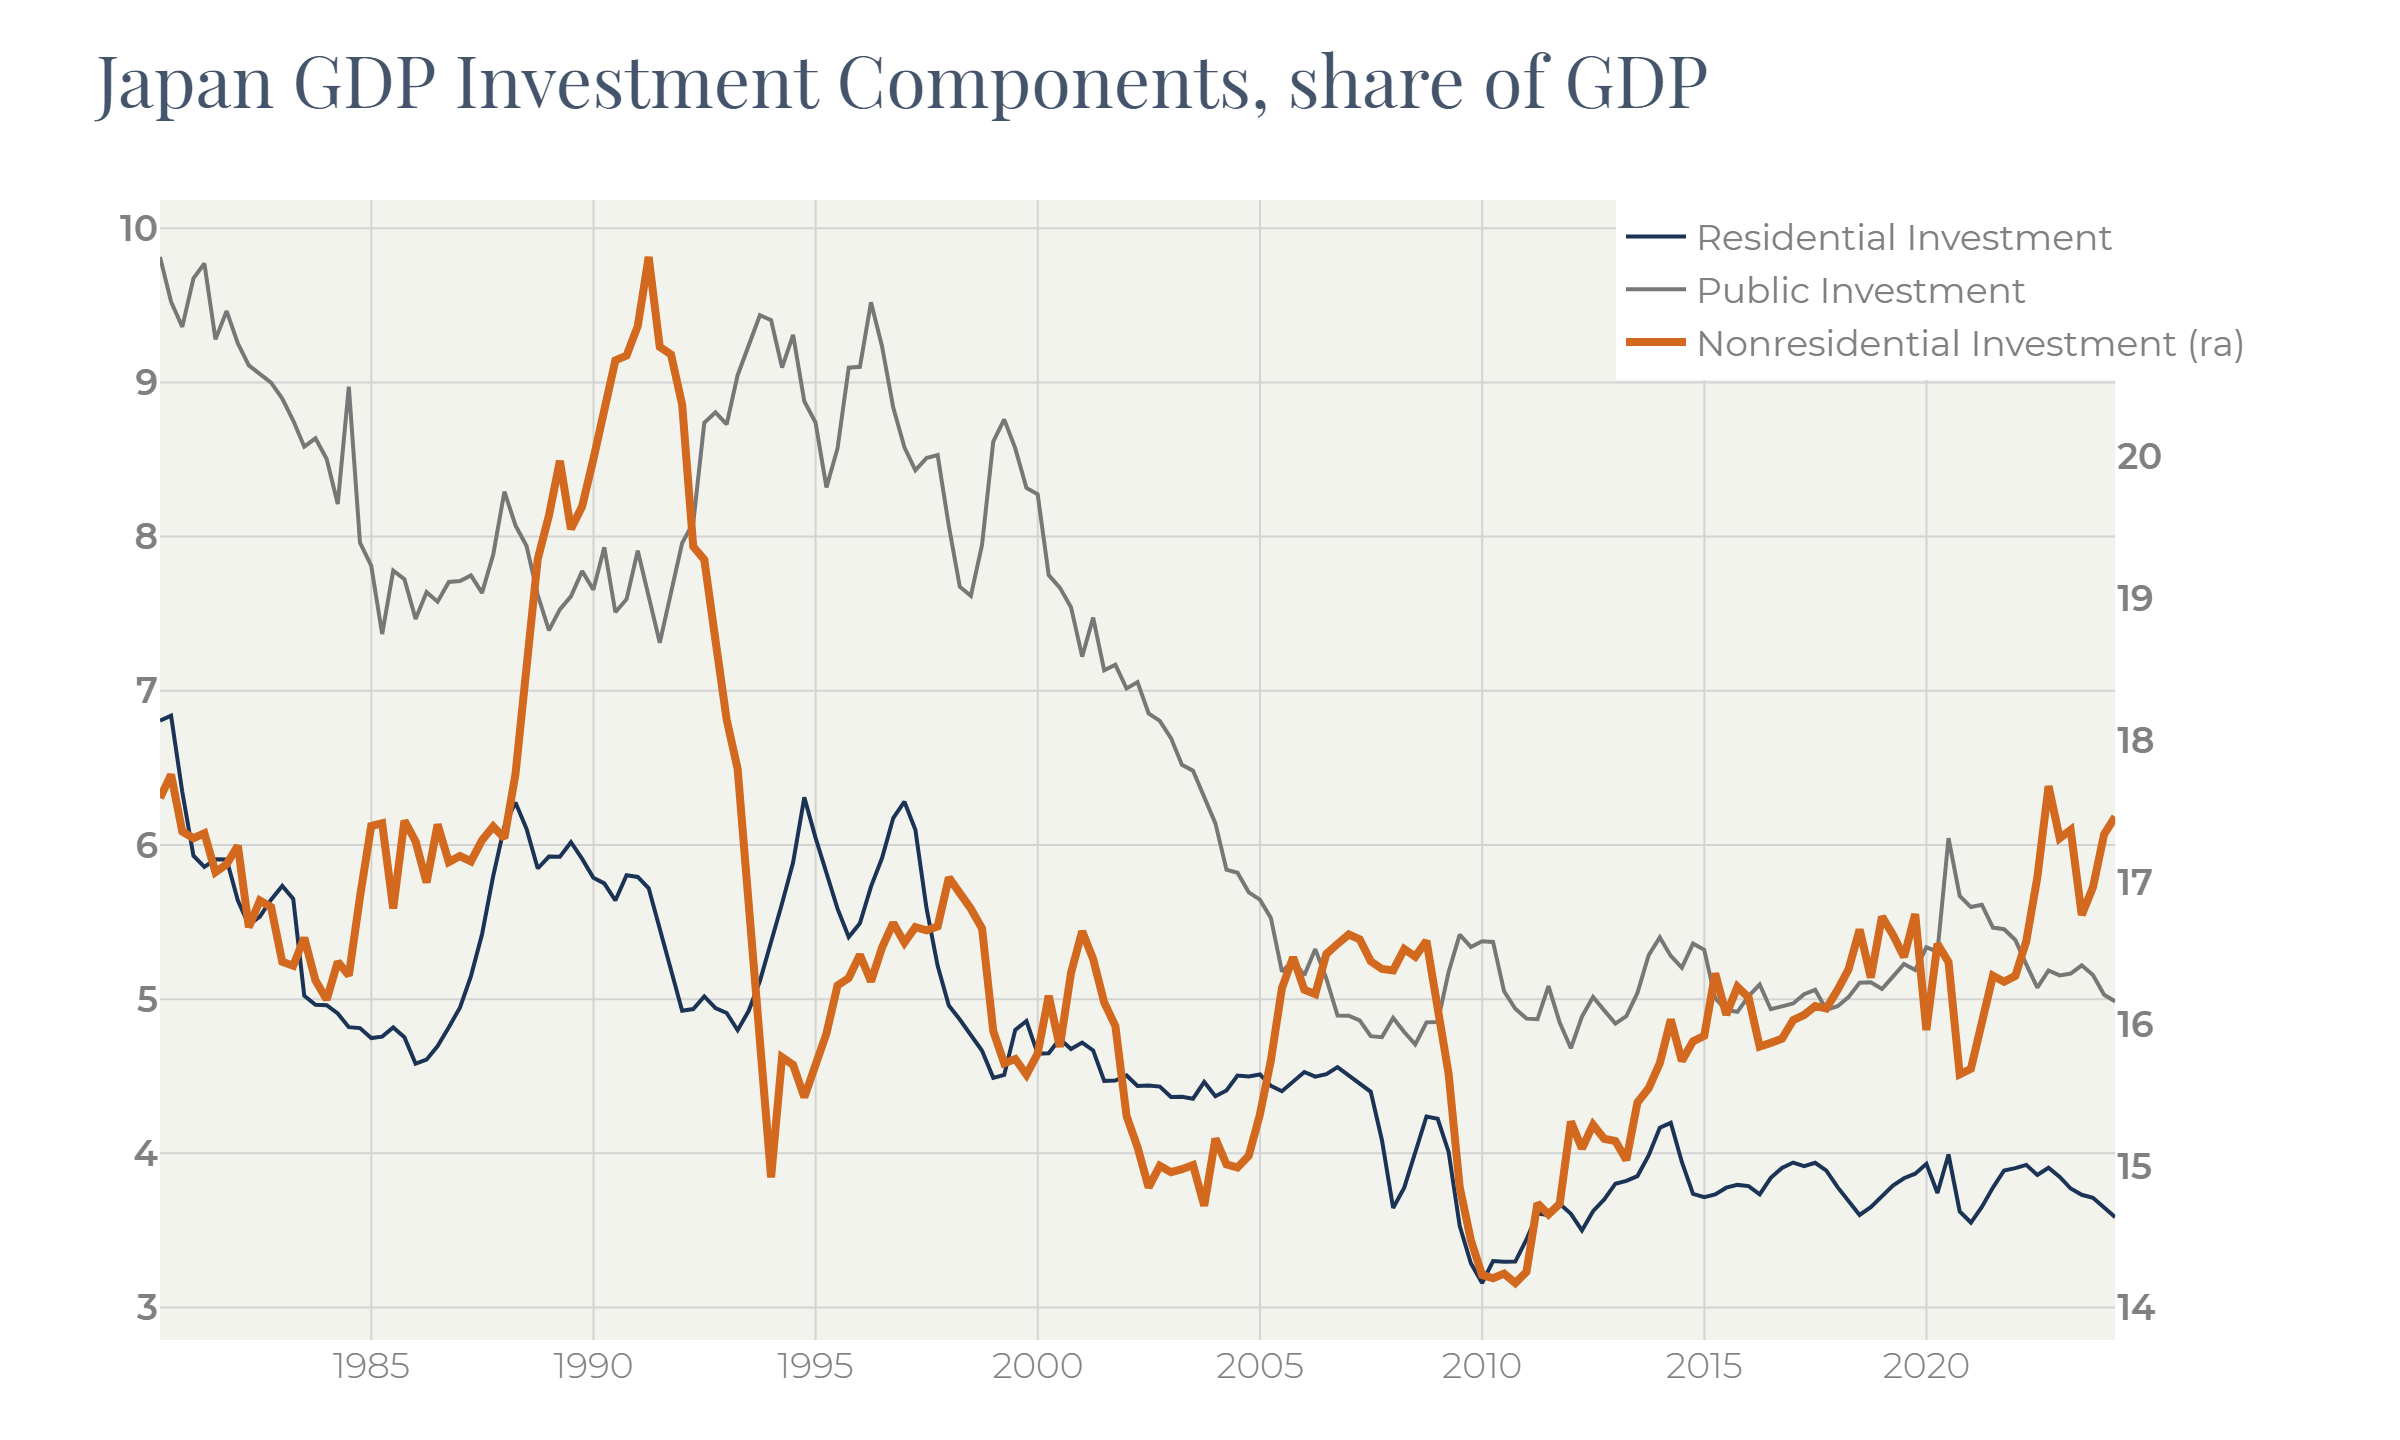
The weakness of the yen is not only a protection against outflow, but it also creates a very attractive environment for investing in the local economy. The Japanese do not have money in their wallets to spend, but they have investments stuck in low-income instruments. Now, with yet low fixed income yields and fear of elevated inflation they shift their investment focus in favor of equity. The cheapness of the currency also creates opportunities for foreign investors. As a result, the Japanese economy has significantly increased its capital expenditures:
Figure 18
The stocks market was also affected by this investment activity: the Nikkey 225 index has risen to its historical high being measured in the US dollars (Figure 19).
Despite the ongoing rally, the Japanese equities are still technically cheap compared to the US market. By the moment there is no technical proof of a recovery. Moreover, the Nikkey P/E ratio is now 26, this is the same level as the S&P 500 has.
Figure 19
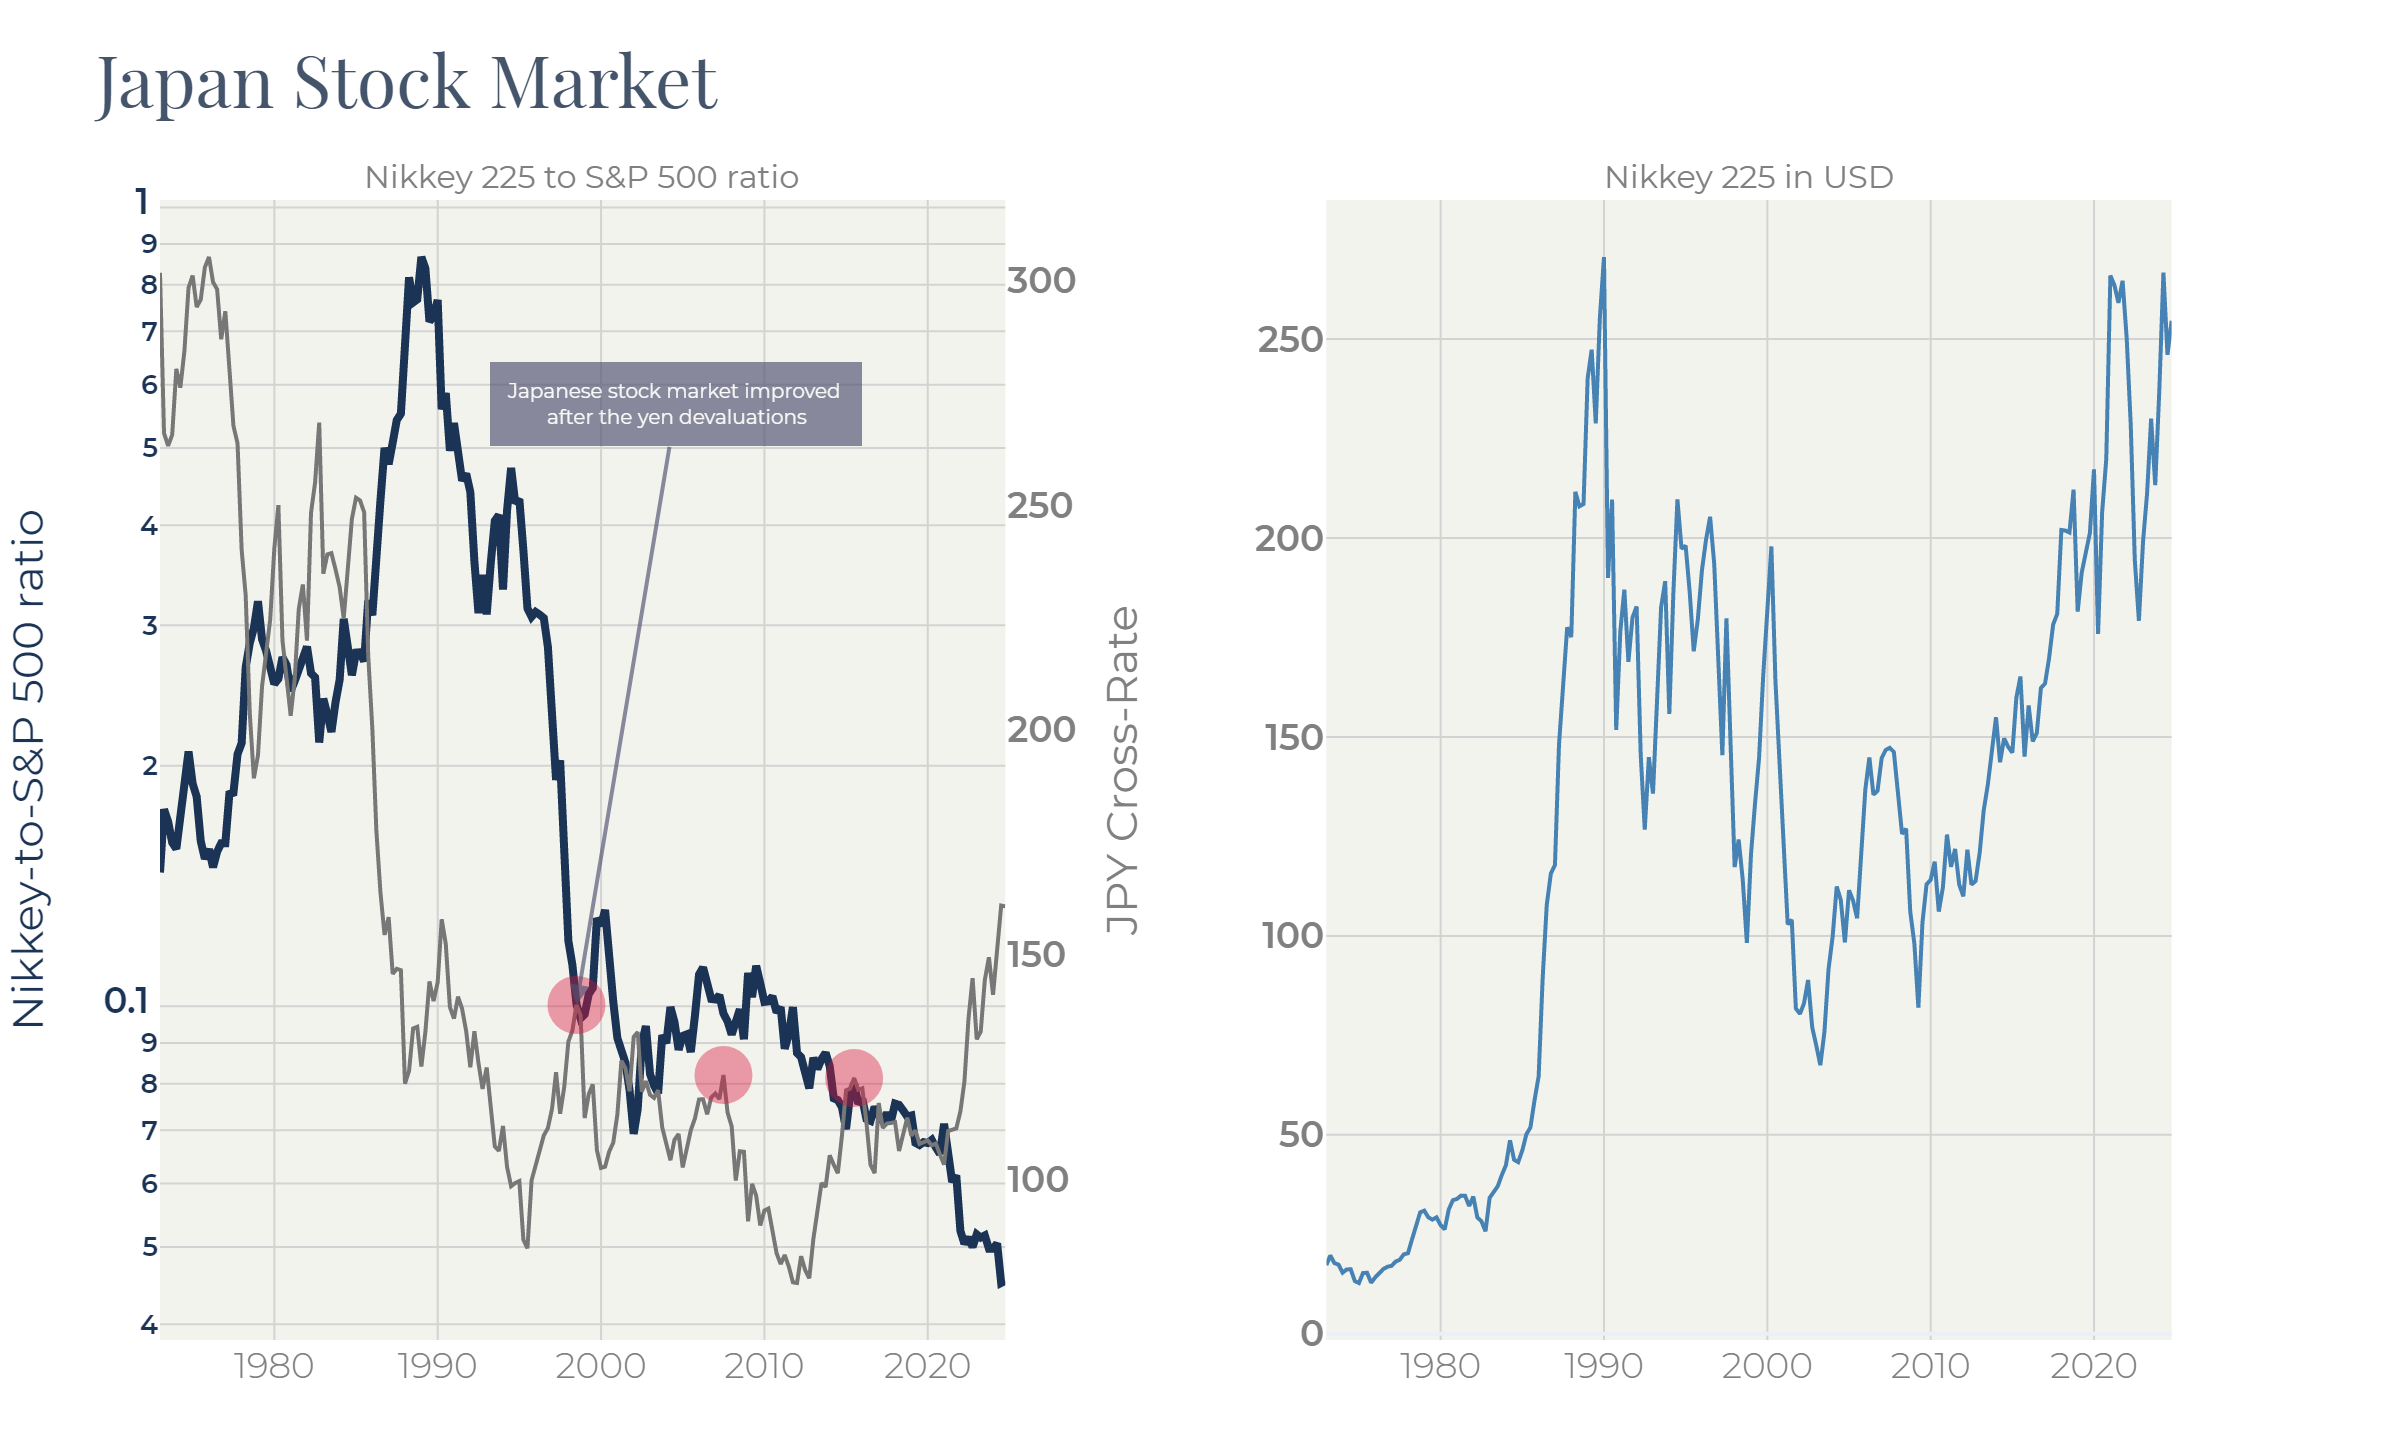
It is worth noticing, though, that a strong currency devaluation historically led to equity rallies. It is possible that Japan will be able to take over some market share from China squeezing profits from the cheap currency on one hand, and deteriorating attractiveness of China for international investors, in the other.
Returning to the yen, we would mention that the Bank of Japan conducts interventions from time to time in attempts to keep the situation under control. The recent one only had a temporary effect:
Figure 20
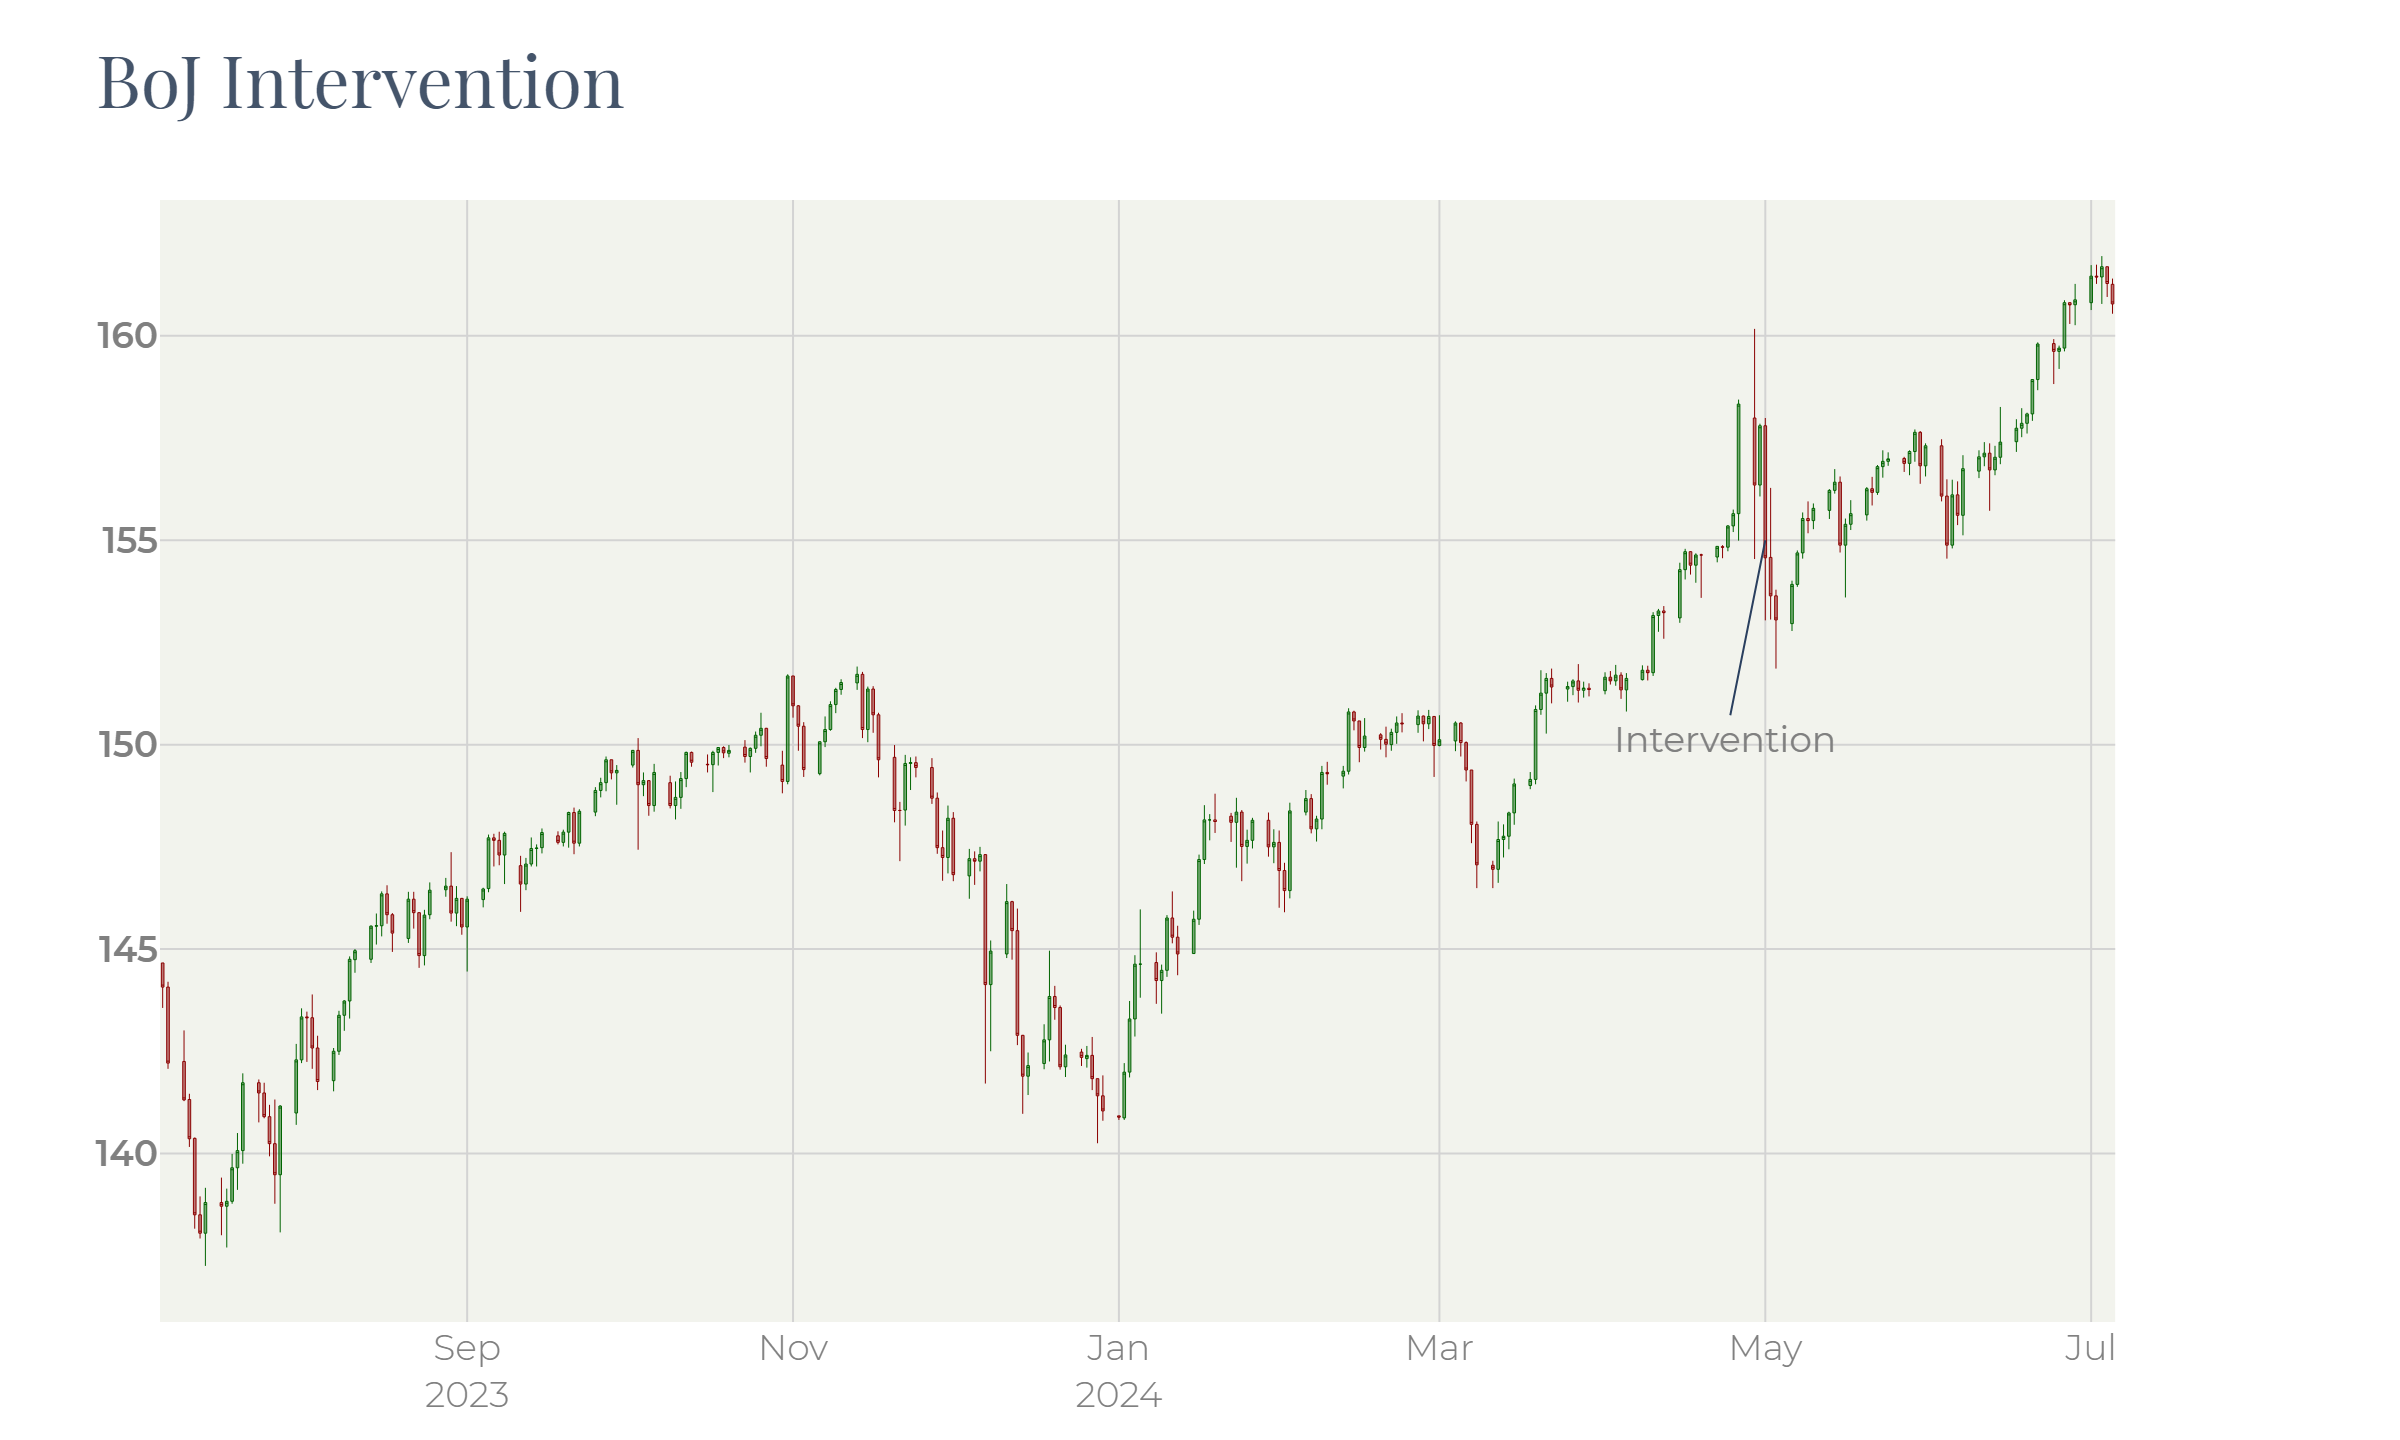
Two weeks after the intervention the BoJ announced that it would reduce purchase of bonds. It provoked a new leg of depreciation with the yen cross-rate breaking through the recent high and reaching a new level.
This just highlight the complexity of the situation the Bank of Japan is in. Trends in financial markets, once they have gained momentum, are often very sustainable. They can drag prices to deeply overvalued or undervalued levels. The recent marking of a new high of the yen cross-rate tells us that the devaluation trend is still in force.
Often trends end up after acceleration and abrupt reversions. It is also possible that correlation between bonds and the currency will weaken – it can also be a harbinger of reversing the course.
Another possible positive driver for Japan is lowering the key rate in the US. First, in this case the US bonds will be no longer as attractive as they are, so the motivation to sell local bonds with the FX loss will disappear. Second, it will eventually encourage consumers to buy durable goods and cars which is an important part of Japanese export.
Summary
Strong devaluation of the Japanese currency is attracting attention of investors. The nature of this phenomenon is entirely connected to the imbalance between local interest rates and the elevated rates in the US and Europe. Another piece of this puzzle is the trade balance of the country. It imports expensive materials and fuel and exports durable and capital goods demand on which is muted because of high rates. The Japan debt burden is a big issue. However, up to the moment it has not been considered by investors as a serious problem. Its direct influence on the yen rate is deeply secondary. The yen’s weakness is creating a very interesting environment already resulting in a surging stock market and elevated level of capital spending. Going forward, export-oriented Japanese companies can benefit from this situation. Imbalances in the fixed-income market still exist, though, with the devaluation trend still in force. With this combination of factors, the Japanese market, albeit being risky, can be a very attractive place to be in coming quarters.
1 . https://www.imf.org/en/Publications/WEO/weo-database/2024/April/weo-report?c=158,&s=NGDP_RPCH,NGDPD,PPPGDP,NGDPDPC,PPPPC,PCPIPCH,LUR,GGXWDG_NGDP,&sy=1980&ey=2029&ssm=0&scsm=1&scc=0&ssd=1&ssc=0&sic=0&sort=country&ds=.&br=1