NVIDIA’s performance impresses: the stock has made more than 50% over the past month. The fundamental factors are clear: growing demand on the fastest processors from the side of Artificial Intelligence services is out of the question. The stock has become impressively expensive, though. The question arises: what can be a potential upside of this company’s shares?
This year P/E estimation is circa 75 (as of the 26th of November the Market Capitalization is $816bn with projected net profit being around $11bn). For the time being the common investor’s approach to pricing of growing companies is that investors should get 5% net profit return in five-year time horizon. This leads us to a conclusion that the current NVDA’s pricing is only fair on case the company will earn not less than $40bn in 5 years. This gives us 30% average CAGR over years to come.
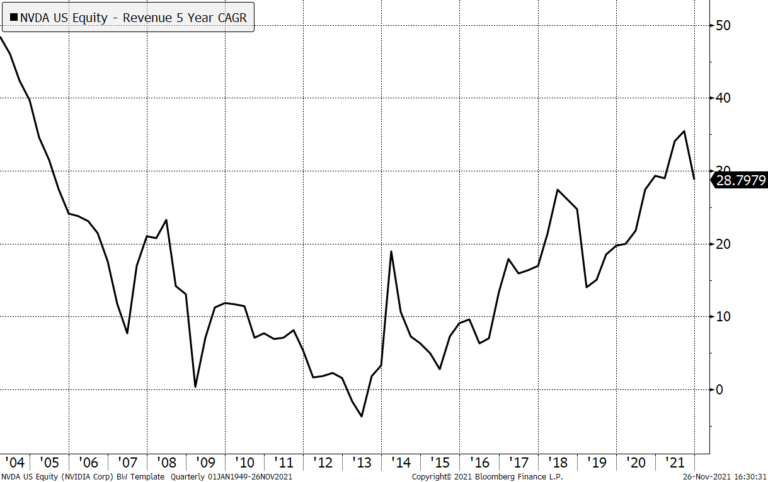
Chart 1. NVDA 5-year CAGR
Looking at the Chart 1 one can find 30% growth rate being a realistic estimation. It is worth mentioning, though, that getting above average return requires buying something undervalued. NVDA’s price-to-sales ratio is currently 33 — that shows that pretty much is already priced in. Buying this stock now only makes sense in case we are sure that the future CAGR will be sustainably above 30% over longer than a five-year period.
It is interesting to compare NVDA to what Intel was twenty tears ago, on the eve of the dot.com crisis. The fundamental reasons of having INTX in portfolios was the same as NVDA is having now. Intel was one of the leaders in the chip-making industry, the prospects of computers and IT industry looked bright.
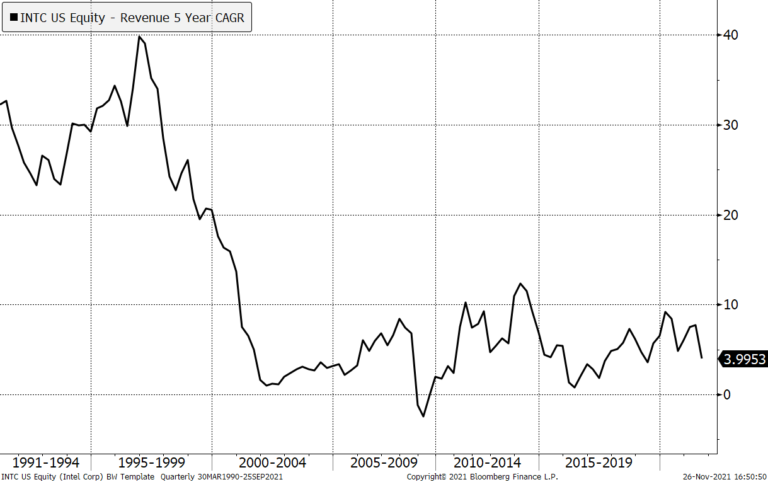
Chart 2. INTS 5-year CAGR
The growth rate of Intel was in uptrend in 1990-s, reaching 40% in 1996. Even after that it continued flying up, so that the Price-to-Sales ratio reached 14.0 in 2000 on the believe in bright prospects of the industry (see Chart 3).
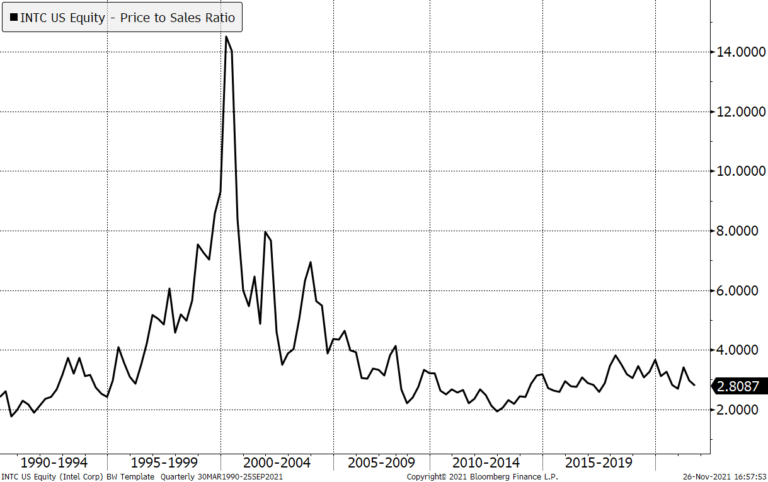
Chart 3. INTC Price-to-Sales ratio
All in all, the Intel share price has not reached 2000 levels yet:
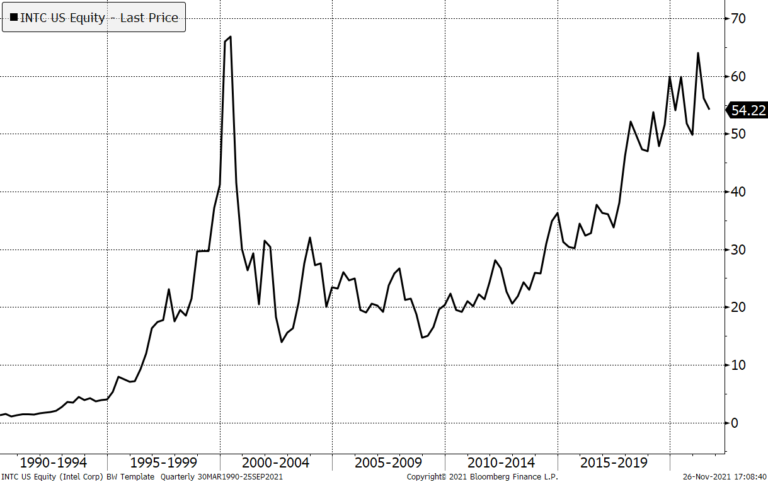
Chart 4. INTC share price
There is another factor one should remember buying NVDA: it’s correlation to Bitcoin (Chart 5). Crypto mining accounts for less than 20% of NVDA’s profits. However, it is sufficient to push NVDA’s CAGR downwards in case of cryptocurrencies downtrend. Bitcoin tends to soar in the beginning of every new halving period and to correct in the second half of halving periods. The present halving period started in May 2020. This means that the risk of XBT correction is high. This means, in turn, that the growing rate of such stocks as NVDA can be put under pressure in the nearest future.
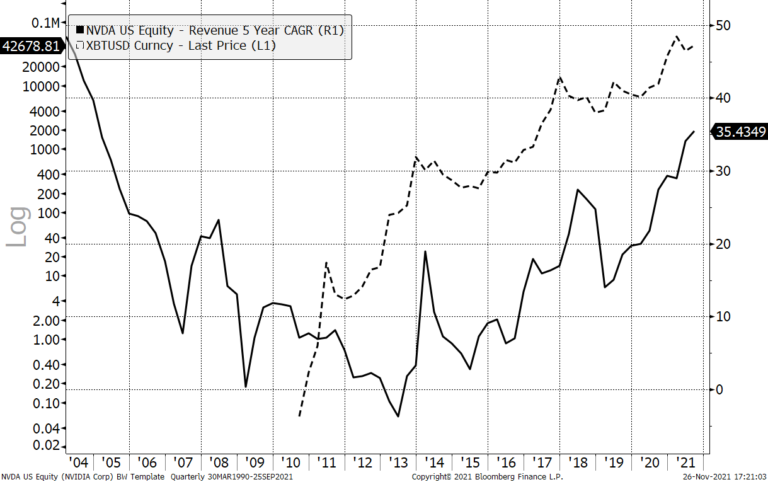
Chart 5. NVDA 5-year CAGR vs Bitcoin price
The resume is that the NVDA’s price has a significant portion of speculative overvaluation.