US inflation figures issued on Tuesday, 14th of November, came in 0.1% lower than estimations. This spiked the rally both in the Equity and FI markets. We would like to highlight two things: the trend in inflation is moving down, and the recent gauge only confirmed that. Secondly, we also observed the positive surprises in June and July, but it could not keep the markets from falling.
With that said, we do not intend to downgrade the importance of inflation data but think that the most valuable is not the data itself but the market reaction to the data.
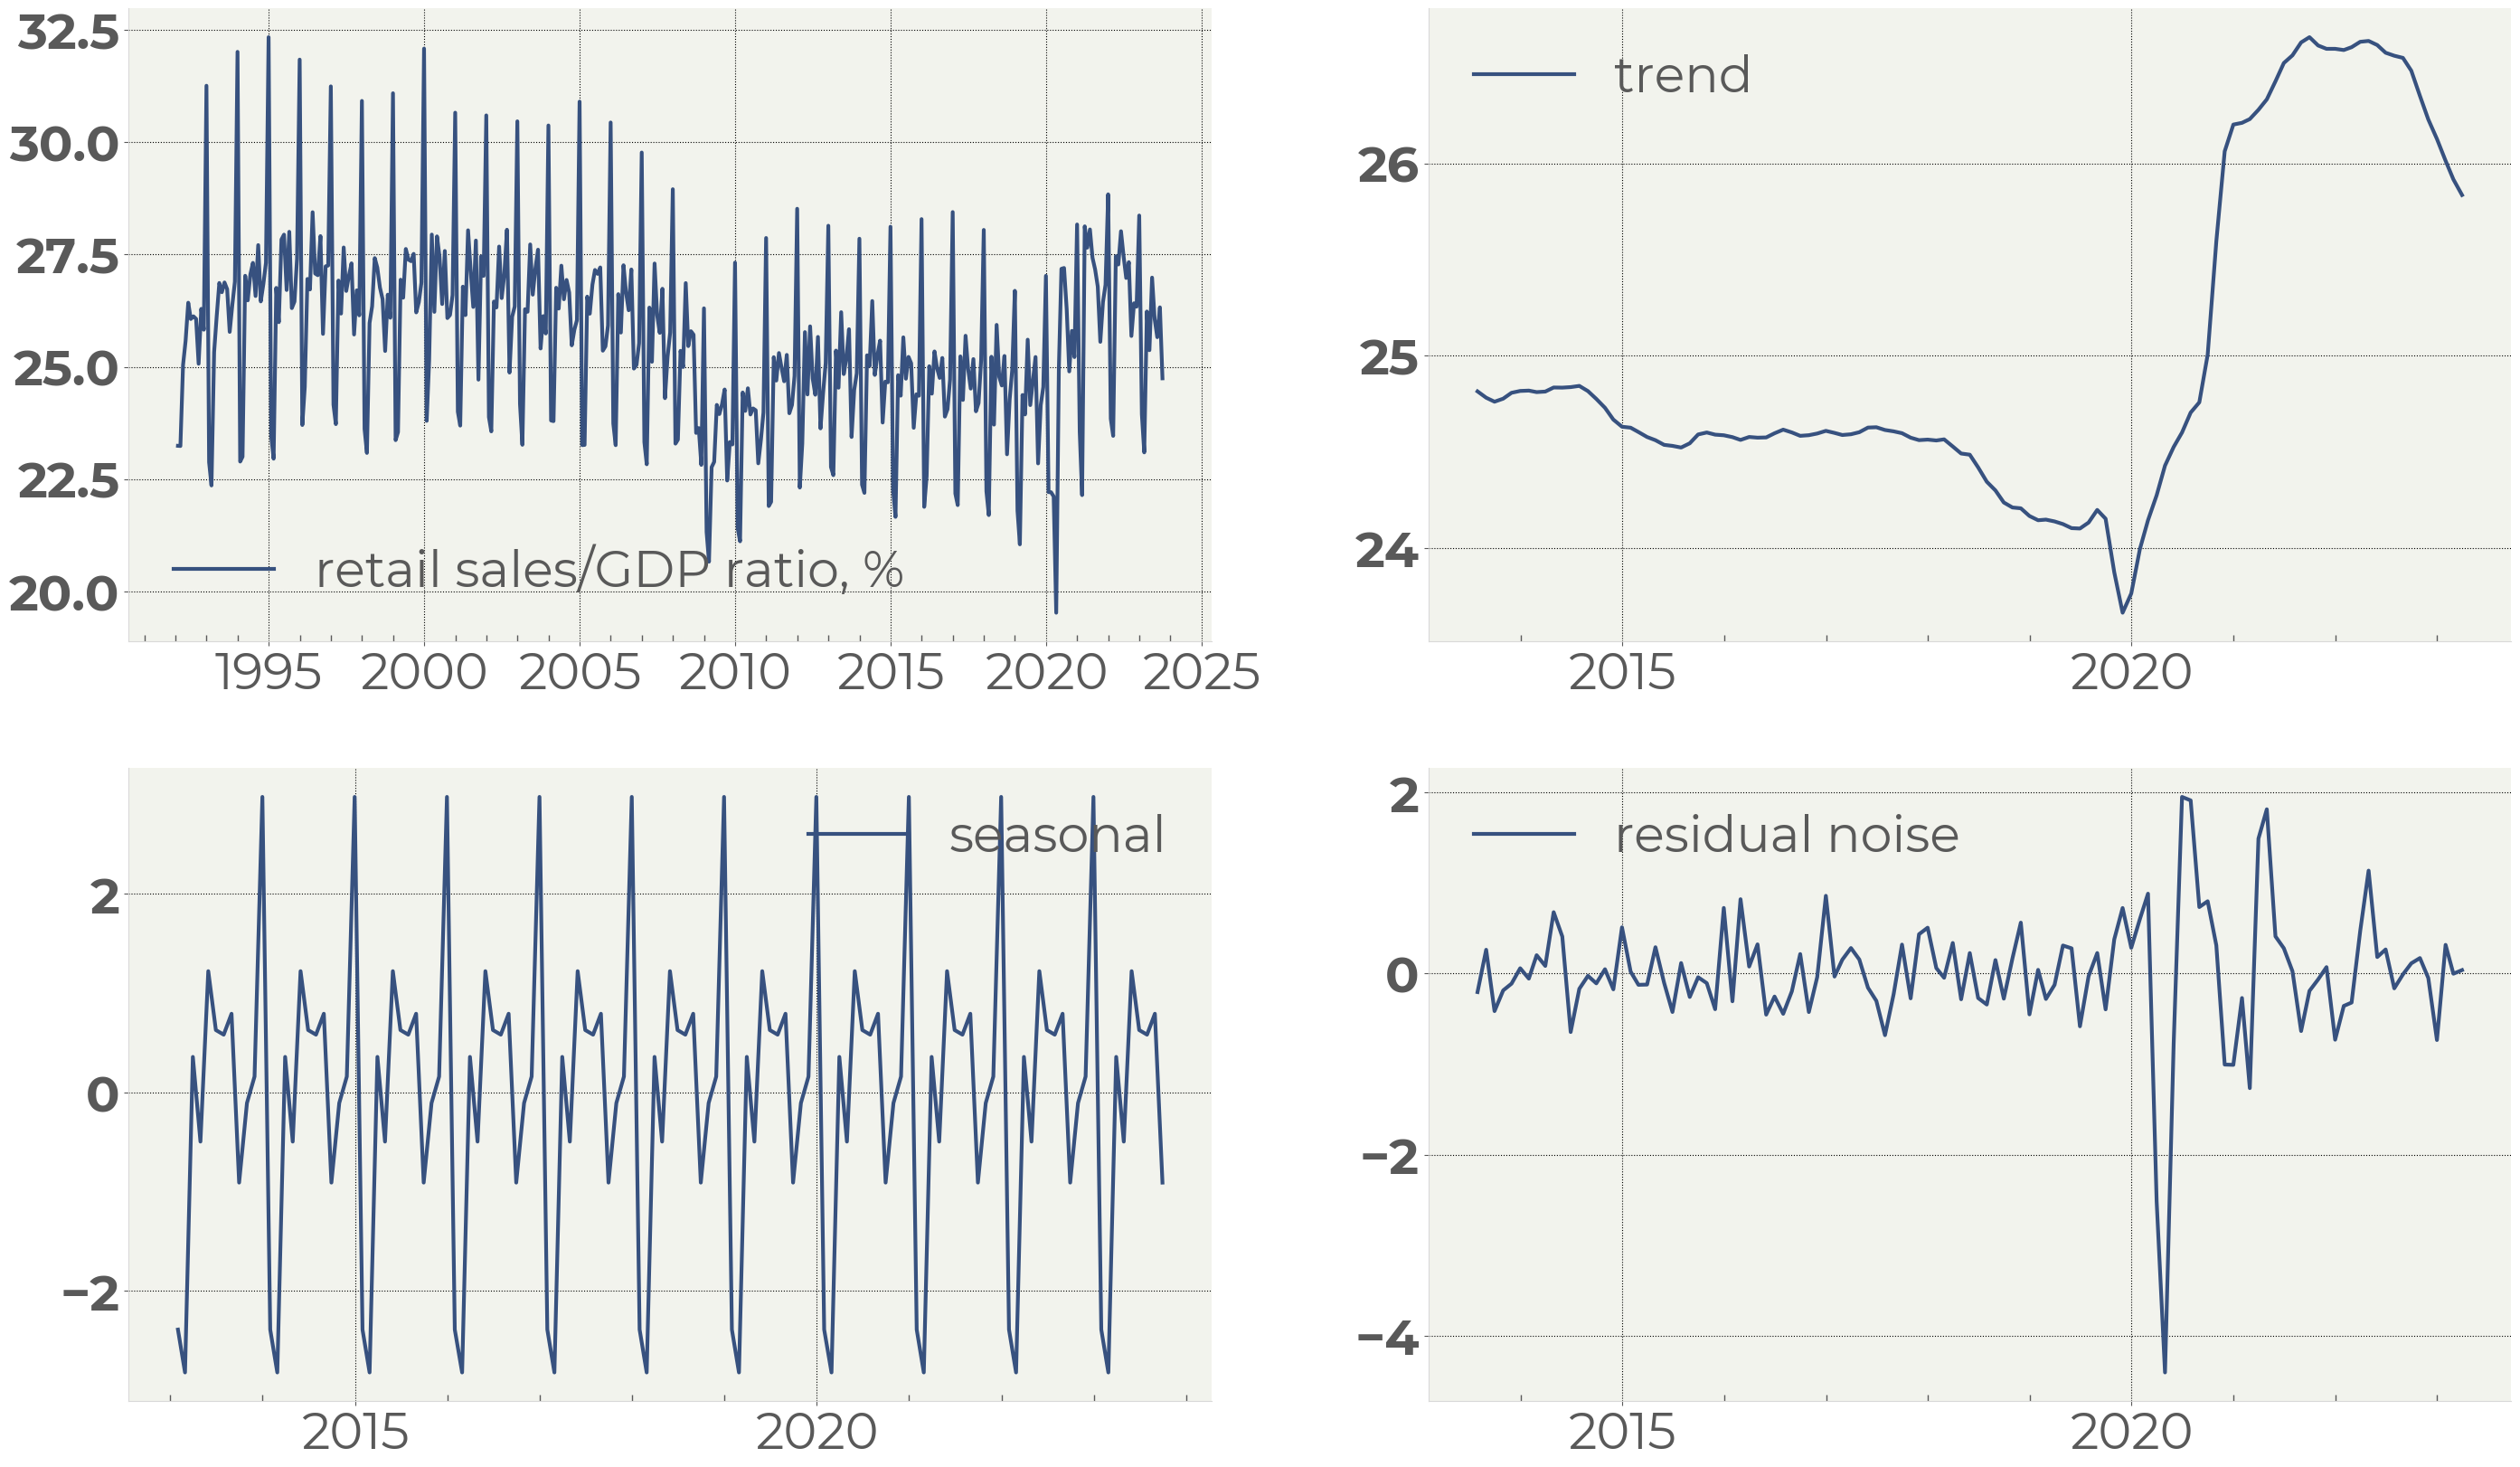
Figure 1 . US Retail sales-to-GDP ratio broken up into components
Today we are going to see another important figure — the retail sales gauges.
Like in case of inflation, the US retail sales have been gradually cooling off over the past year. The recent two readings brought negative surprises, but it also was no more than fluctuations around the falling trend. We broke the retail sales-to-GDP ratio into its seasonal components to demonstrate that (Figure 1).
The heatmap on Figure 2 tells that the retail sales dynamics has been in line with the general behavior of this measure.
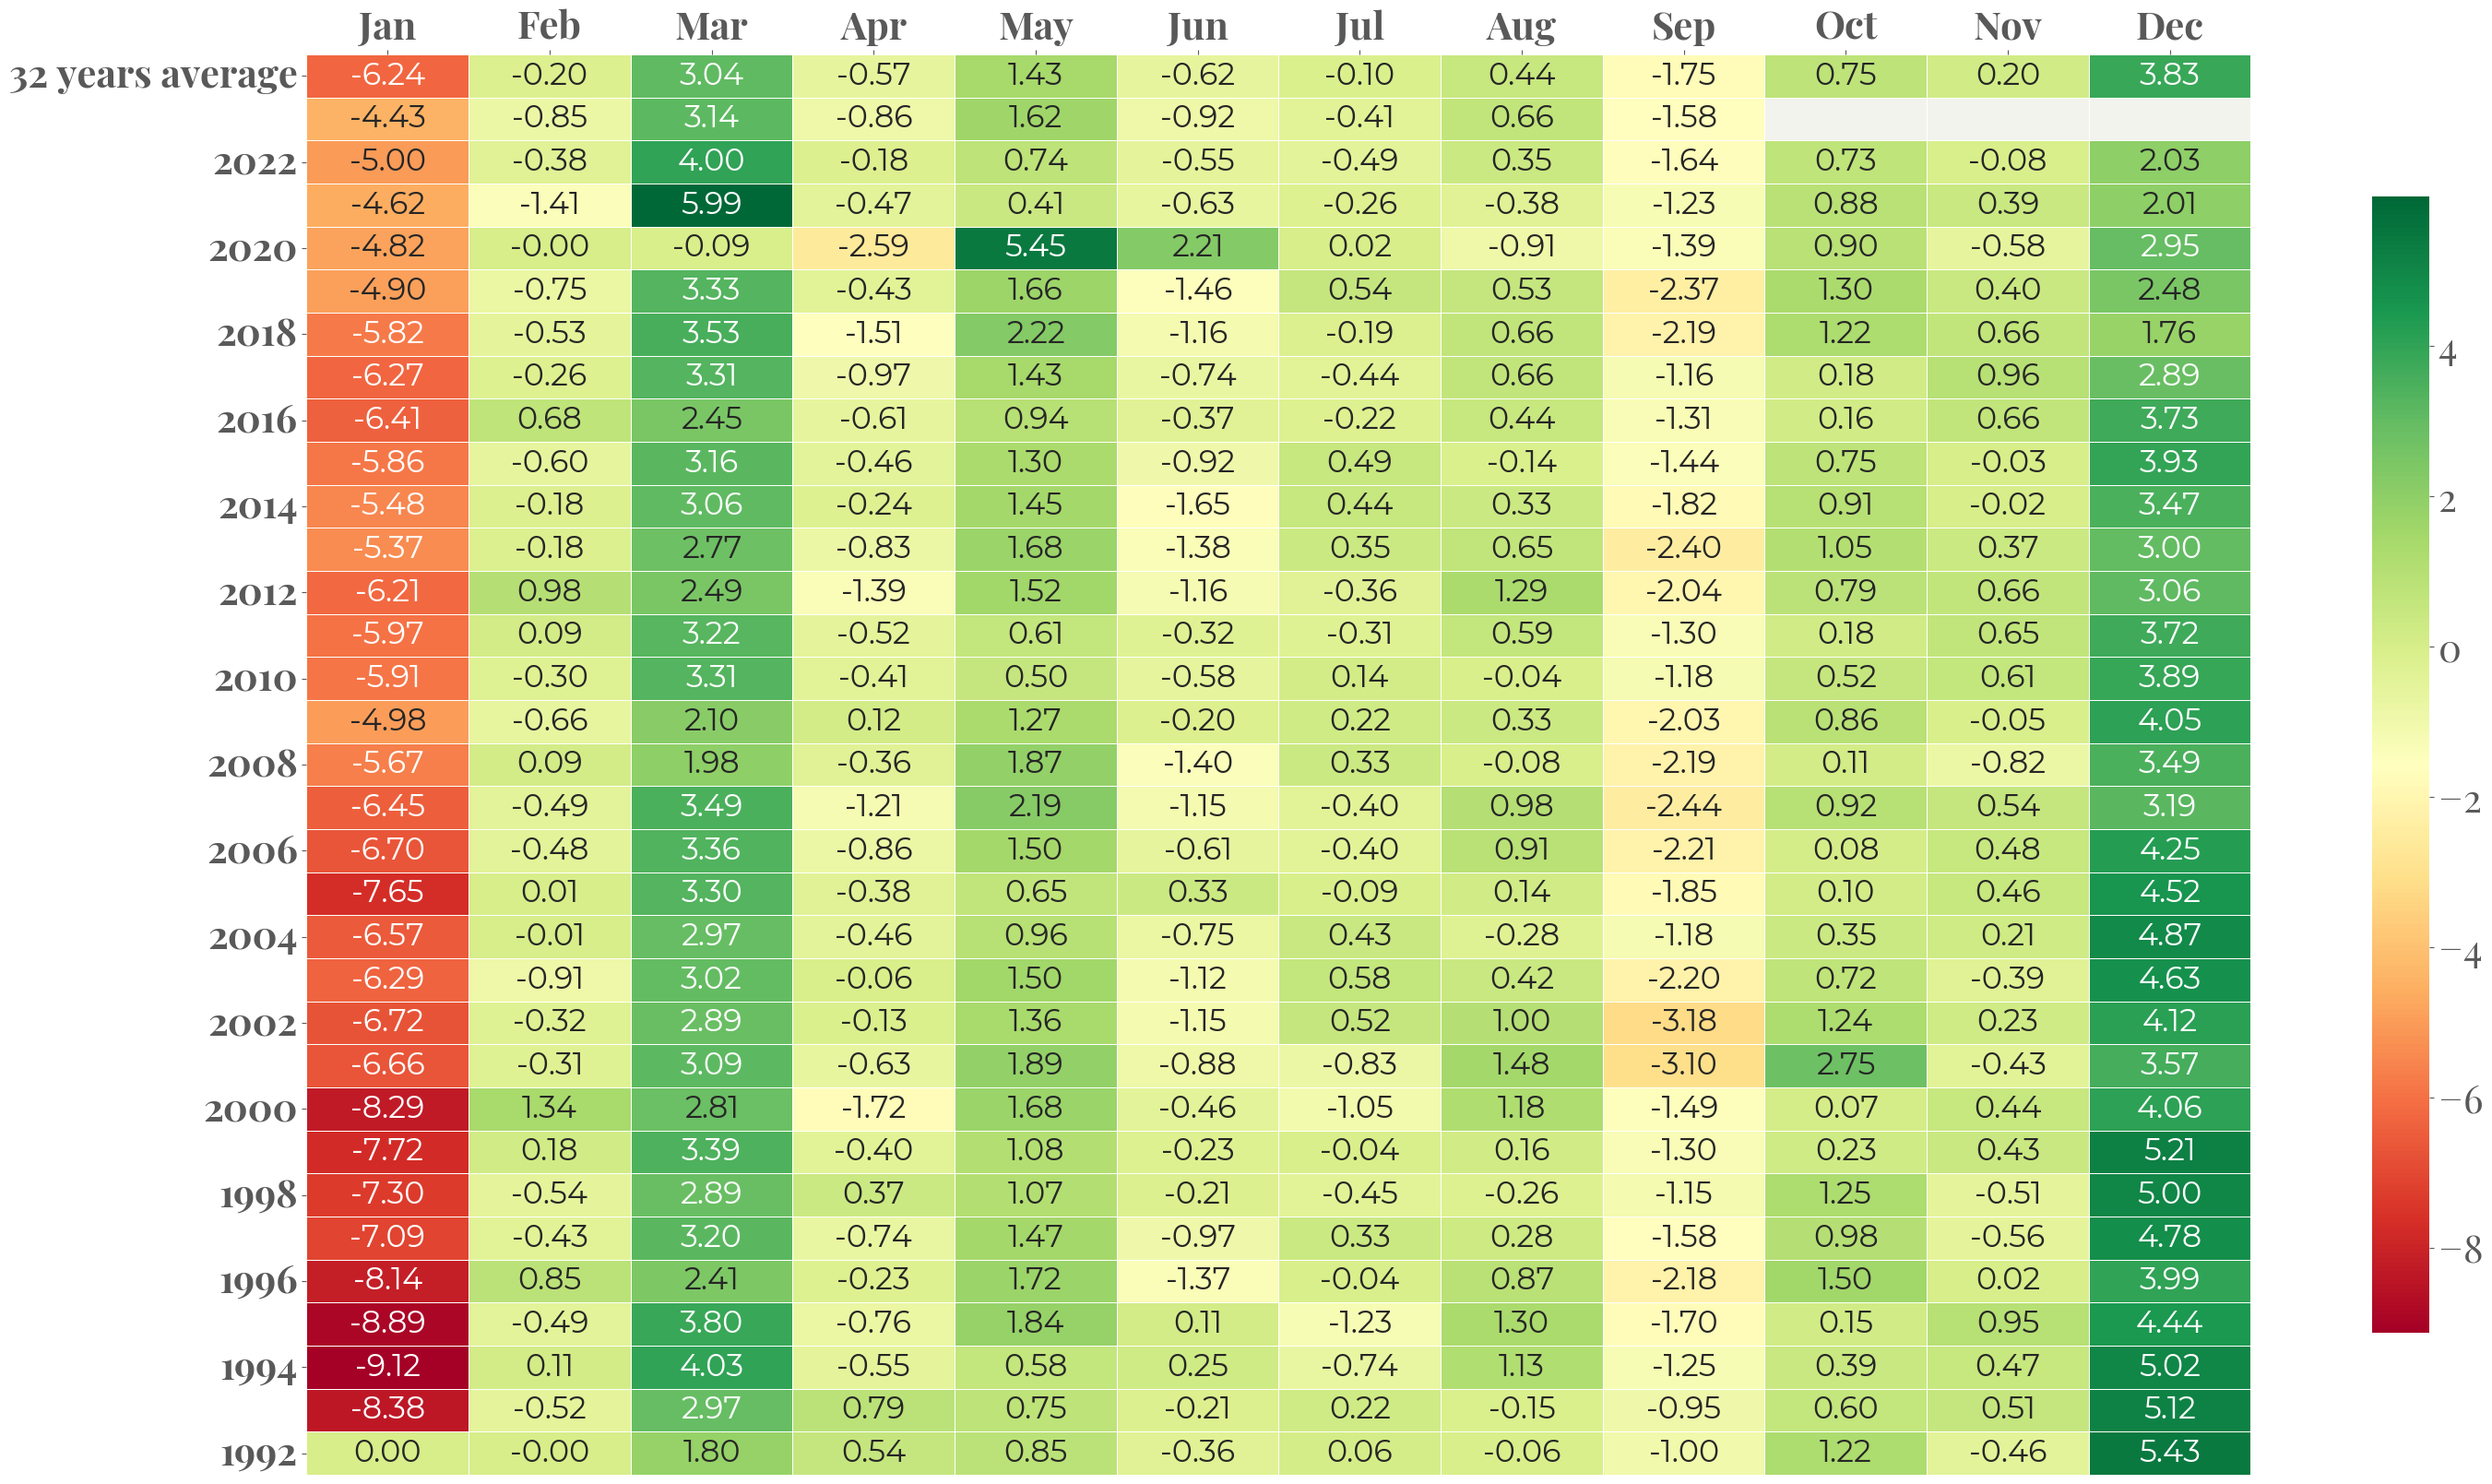
Figure 2 . US Retail sales-to-GDP ratio monthly change heatmap
It is interesting that we observed stronger-than-average retail sales in August and September when the inflation was a bit higher than surveys showed. Likewise, it was weaker than average in June and July when we got weaker inflation figures.
We will see soon if this correlation works out in October. If it does, it can be an additional positive driver for the market.