The US Debt ceiling once again has become a serious issue like it was in 2011 when S&P downgraded the credit rating of the US. It raised questions on a possible US debt default.
Background
Since 1917 the US Congress must authorize borrowing setting the limit for the Treasury so that the Treasury did not need to ask for a permission each time it needed to issue bonds. For many years raising the debt ceiling was routine. The situation changed in the 1990s when the political environment became more polarized.
The first serious debt ceiling crisis happened in 2011 when the Republican party insisted the limit should not be raised without budget spending reforms. The country had come close to a point of a potential default before the conflict between the White House and the Congress was resolved on August 2, 2011. It showed, however, that the debt payoff is not axiomatic but can be a result of battles inside the US political circles. Three days on, on August 5, Standard & Poors issued the first ever downgrade in the US credit rating.
In 2023 this pattern has been reproduced. The US hit its technical debt limit on January 19. Since then, The Treasury Department has been using ‘extraordinary measures’ that are limited, however, by the financial ability of the country to repay its debt. The Bipartisan Policy Center, which tracks the debt limit deadline, estimates that the Treasury will run out of cash sometime between June and August 2023:
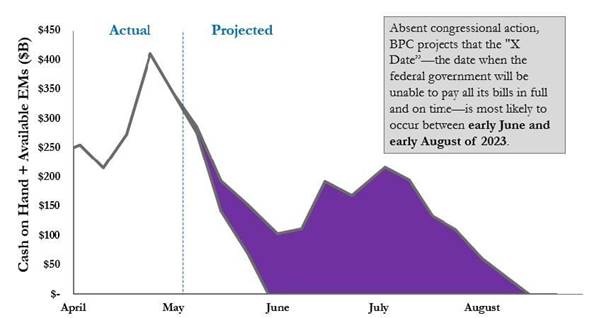
Figure 1. BPC projection of the Treasury’s ability to pay its bills. (https://bipartisanpolicy.org/explainer/debt-limit-analysis-may-2023/)
Understanding the degree of the Government’s dependence on the House, the Republicans controlling the Congress, proposed a budget spending cuts plan in return to their support for the debt ceiling upgrade.
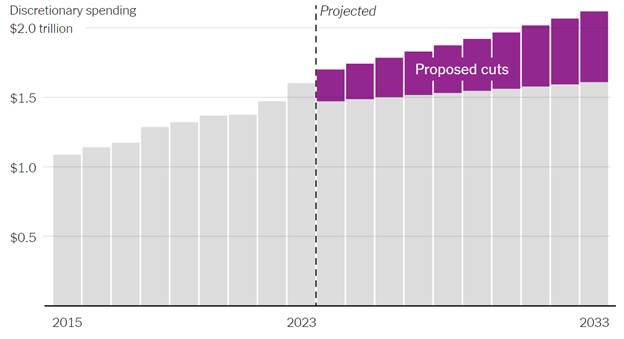
Figure 2. Proposed budget cuts by GOP. Source: The New York Times (https://www.nytimes.com/interactive/2023/05/08/upshot/federal-budget-republicans.html)
Proposed GOP plans imply an 18% cut of budget spendings. It could be real if the republicans were not insisting on excluding from the cuts plan the defense and veterans’ payments making up for a major share of total budget expenditures. In case these two categories are left as it is all other spendings must be cut by 51% which seems unrealistic.
The House speaker Kevin McCarthy insists that the debt ceiling negotiations should be tied to the federal spendings reduction. President Biden, in turn, wants Congress to raise the debt limit without any conditions. One way or another, negotiations in the matter have begun.
We cannot disagree with the Treasury Department head Janet Yellen that failure to raise the debt ceiling would an economic catastrophe1 . The same reason, however, is backing up the point of view of many economists considering the risk of not raising the debt ceiling being too obvious for GOP to do that. The US has raised the borrowing limit 78 times, so why not do it one more time?
Financial markets history tells us that defaults happen sometimes, but in all cases, governments were unable to pay their bills: it was the case of Argentina 2020, Russia 1998, Mexico 1982, Brazil 1990, and others.
So, the question is: are there any signs, except the GOP bill, of crossing red lines with borrowings in the US?
Macro view
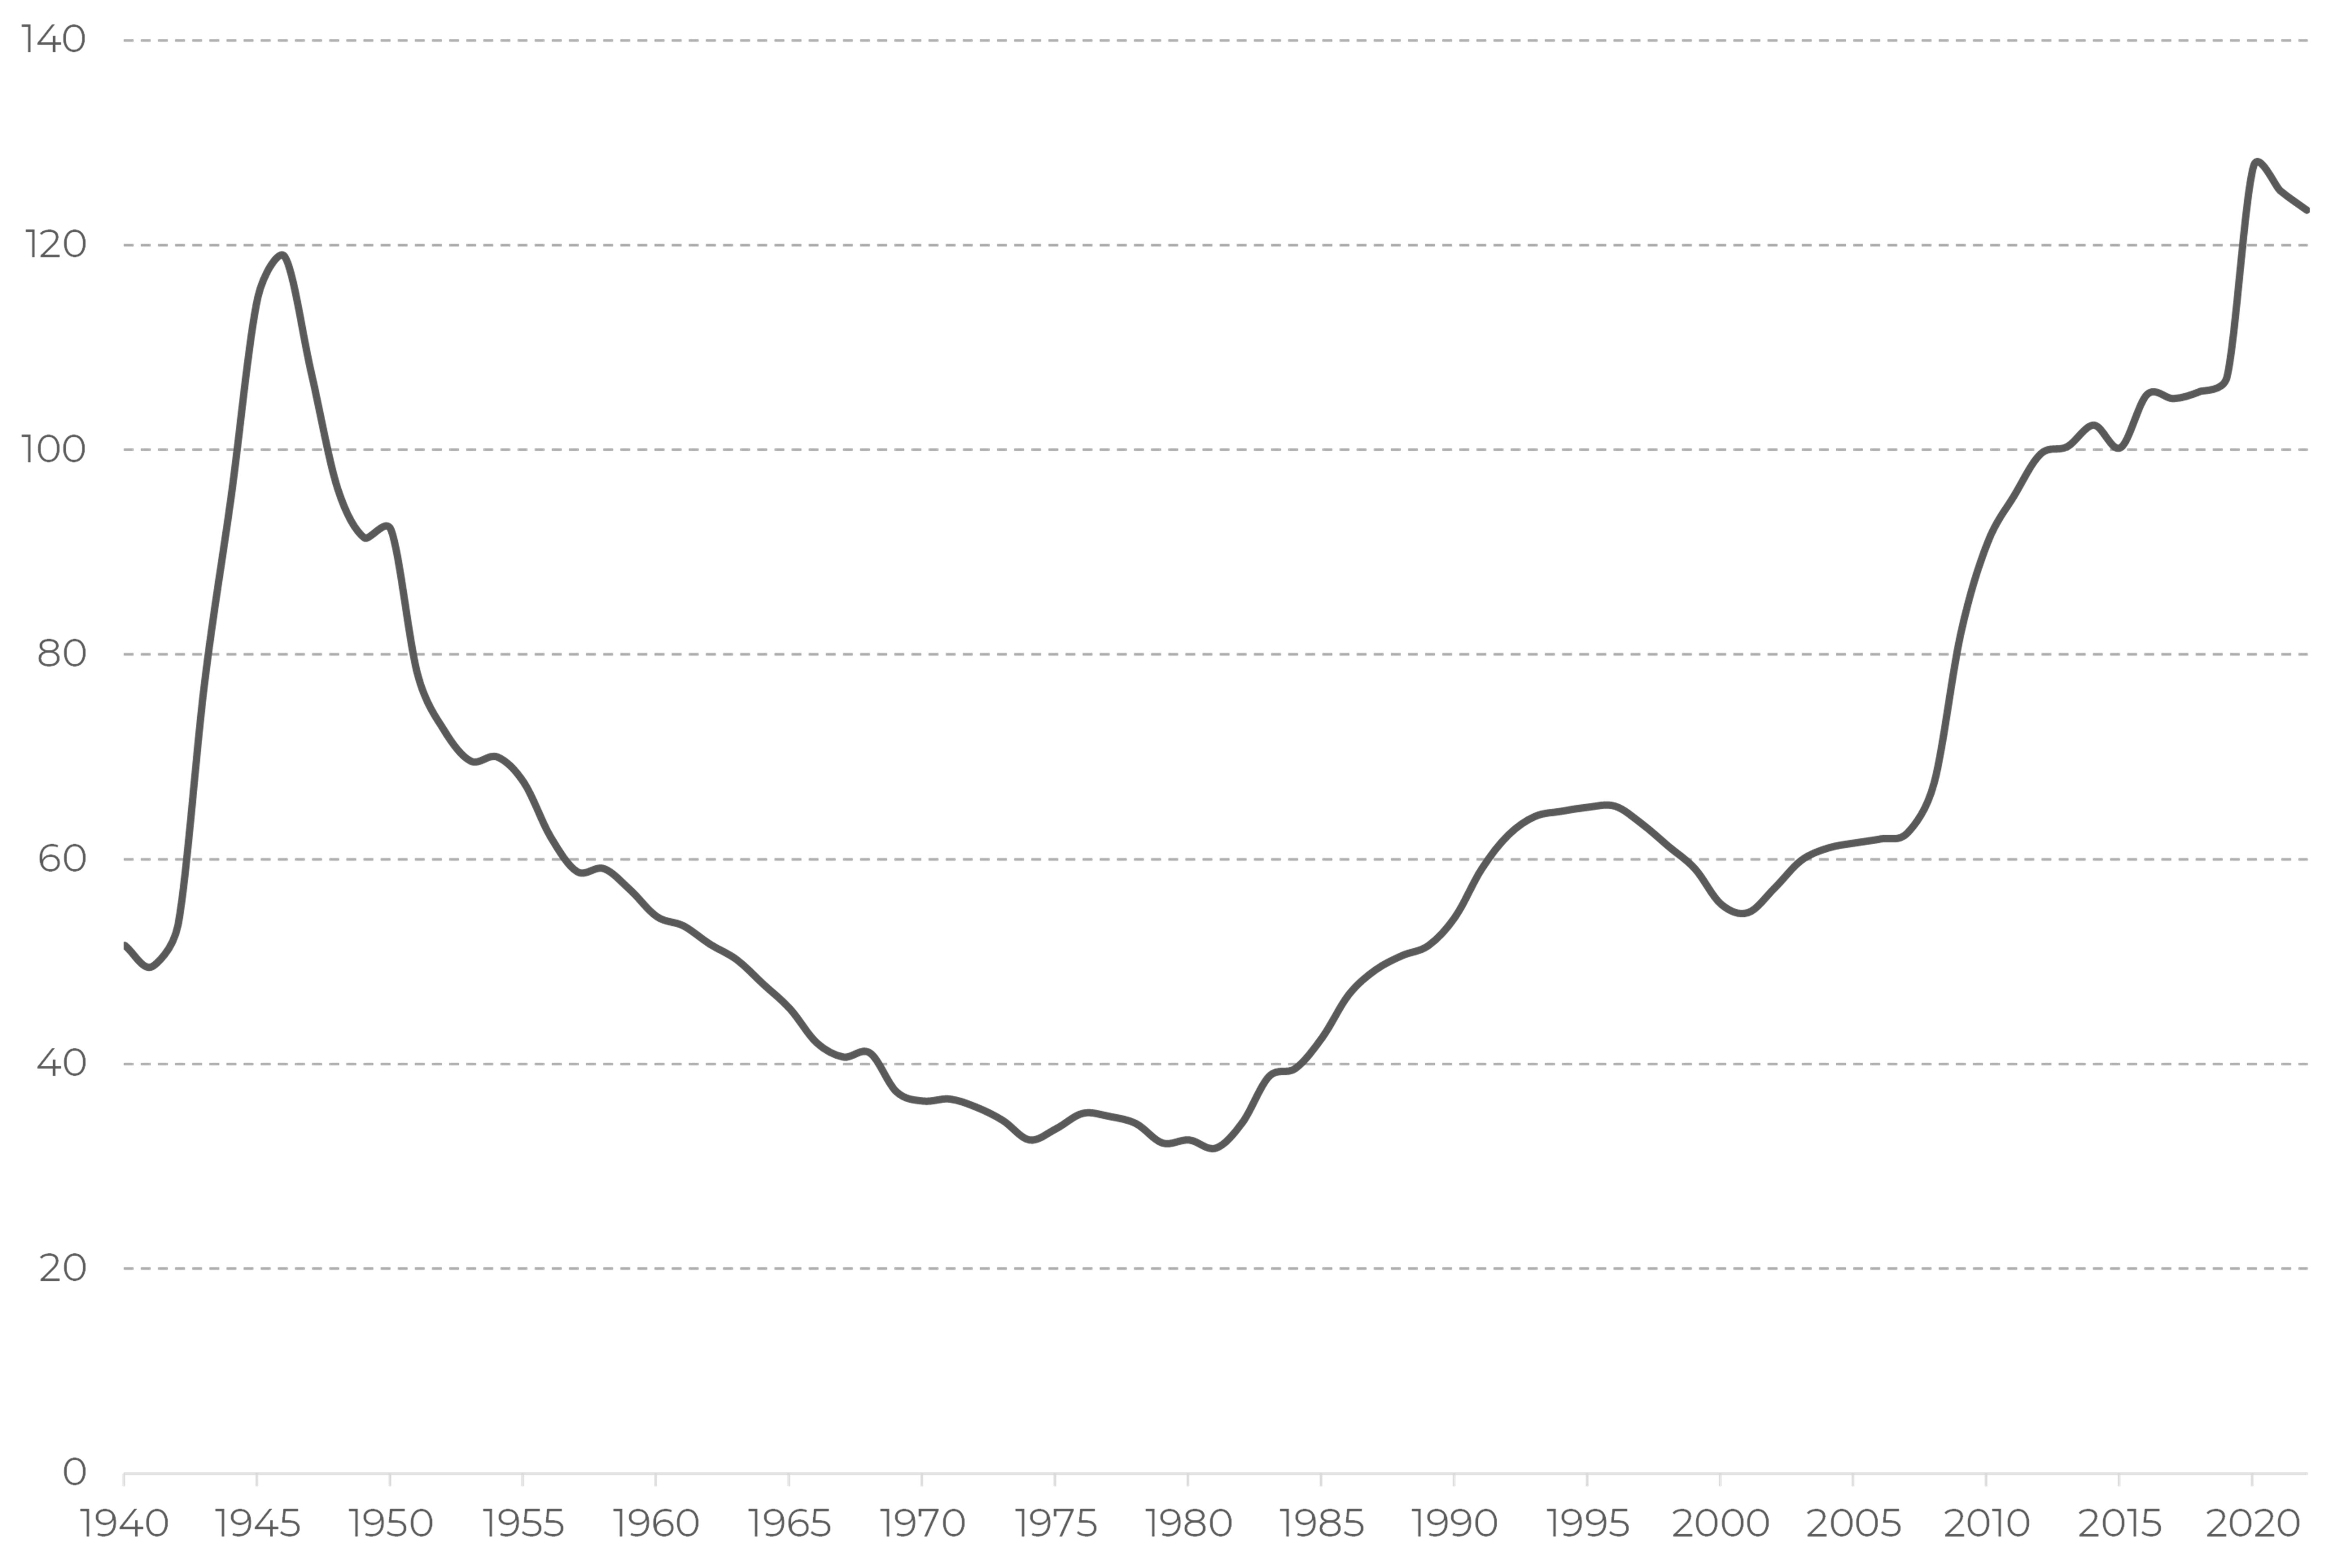
Figure 3. US gross federal debt, % of GDP
After a short period of stability in 2010—2020, the US federal exceeded its historical high of 120% of GDP on the back of fighting the pandemic. The previous debt surge was caused by the 2008 financial crisis.
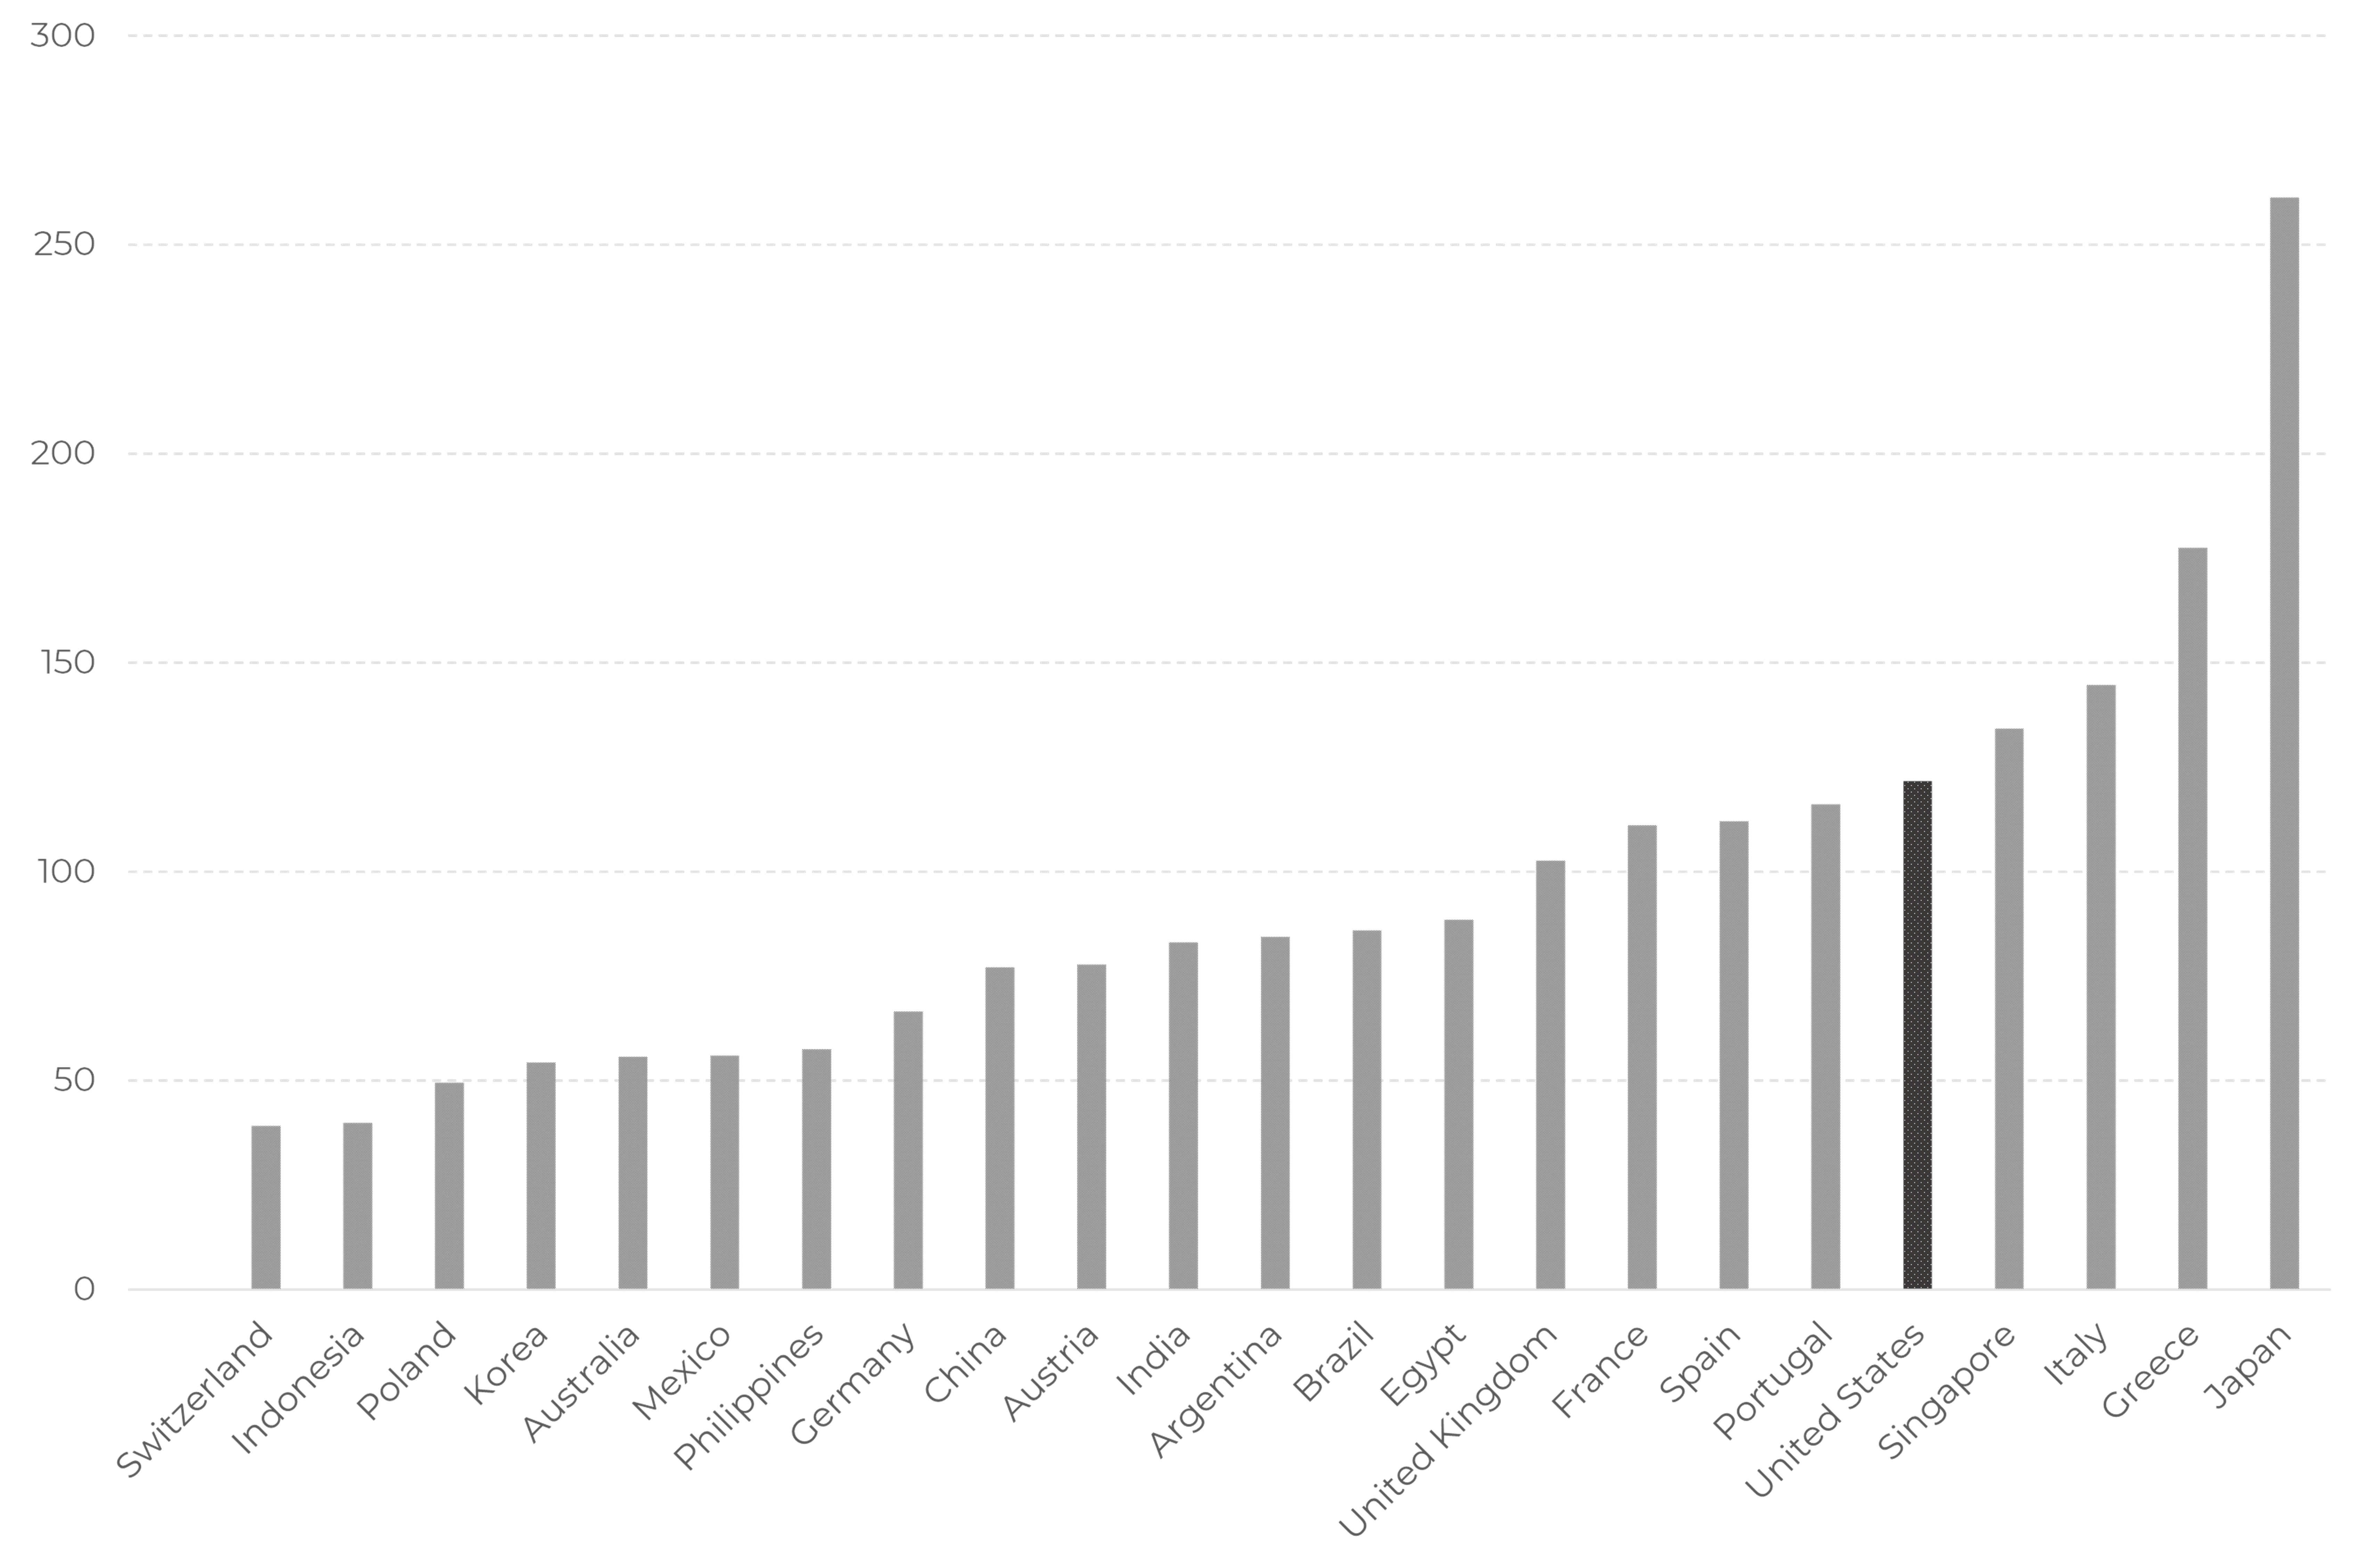
Figure 4. Government gross debt, % of GDP. 2022.
The US debt level is in the center of a ‘troublemakers’’ company: Italy, Greece, Portugal, and Spain. All these countries have experienced debt crises over the past decade.
However, Singapore and especially Japan, having more substantial government debt burden, are considered as high-quality lenders.
The explanation for this phenomenon lies partly in economic diversification. Figure 5 represents an EDI (economic diversification index) score for the countries with the score above 100. One can easily notice that the 120+ score countries have never faced debt issues. Needless to say, that the US economy is more diversified than that of France or Japan.
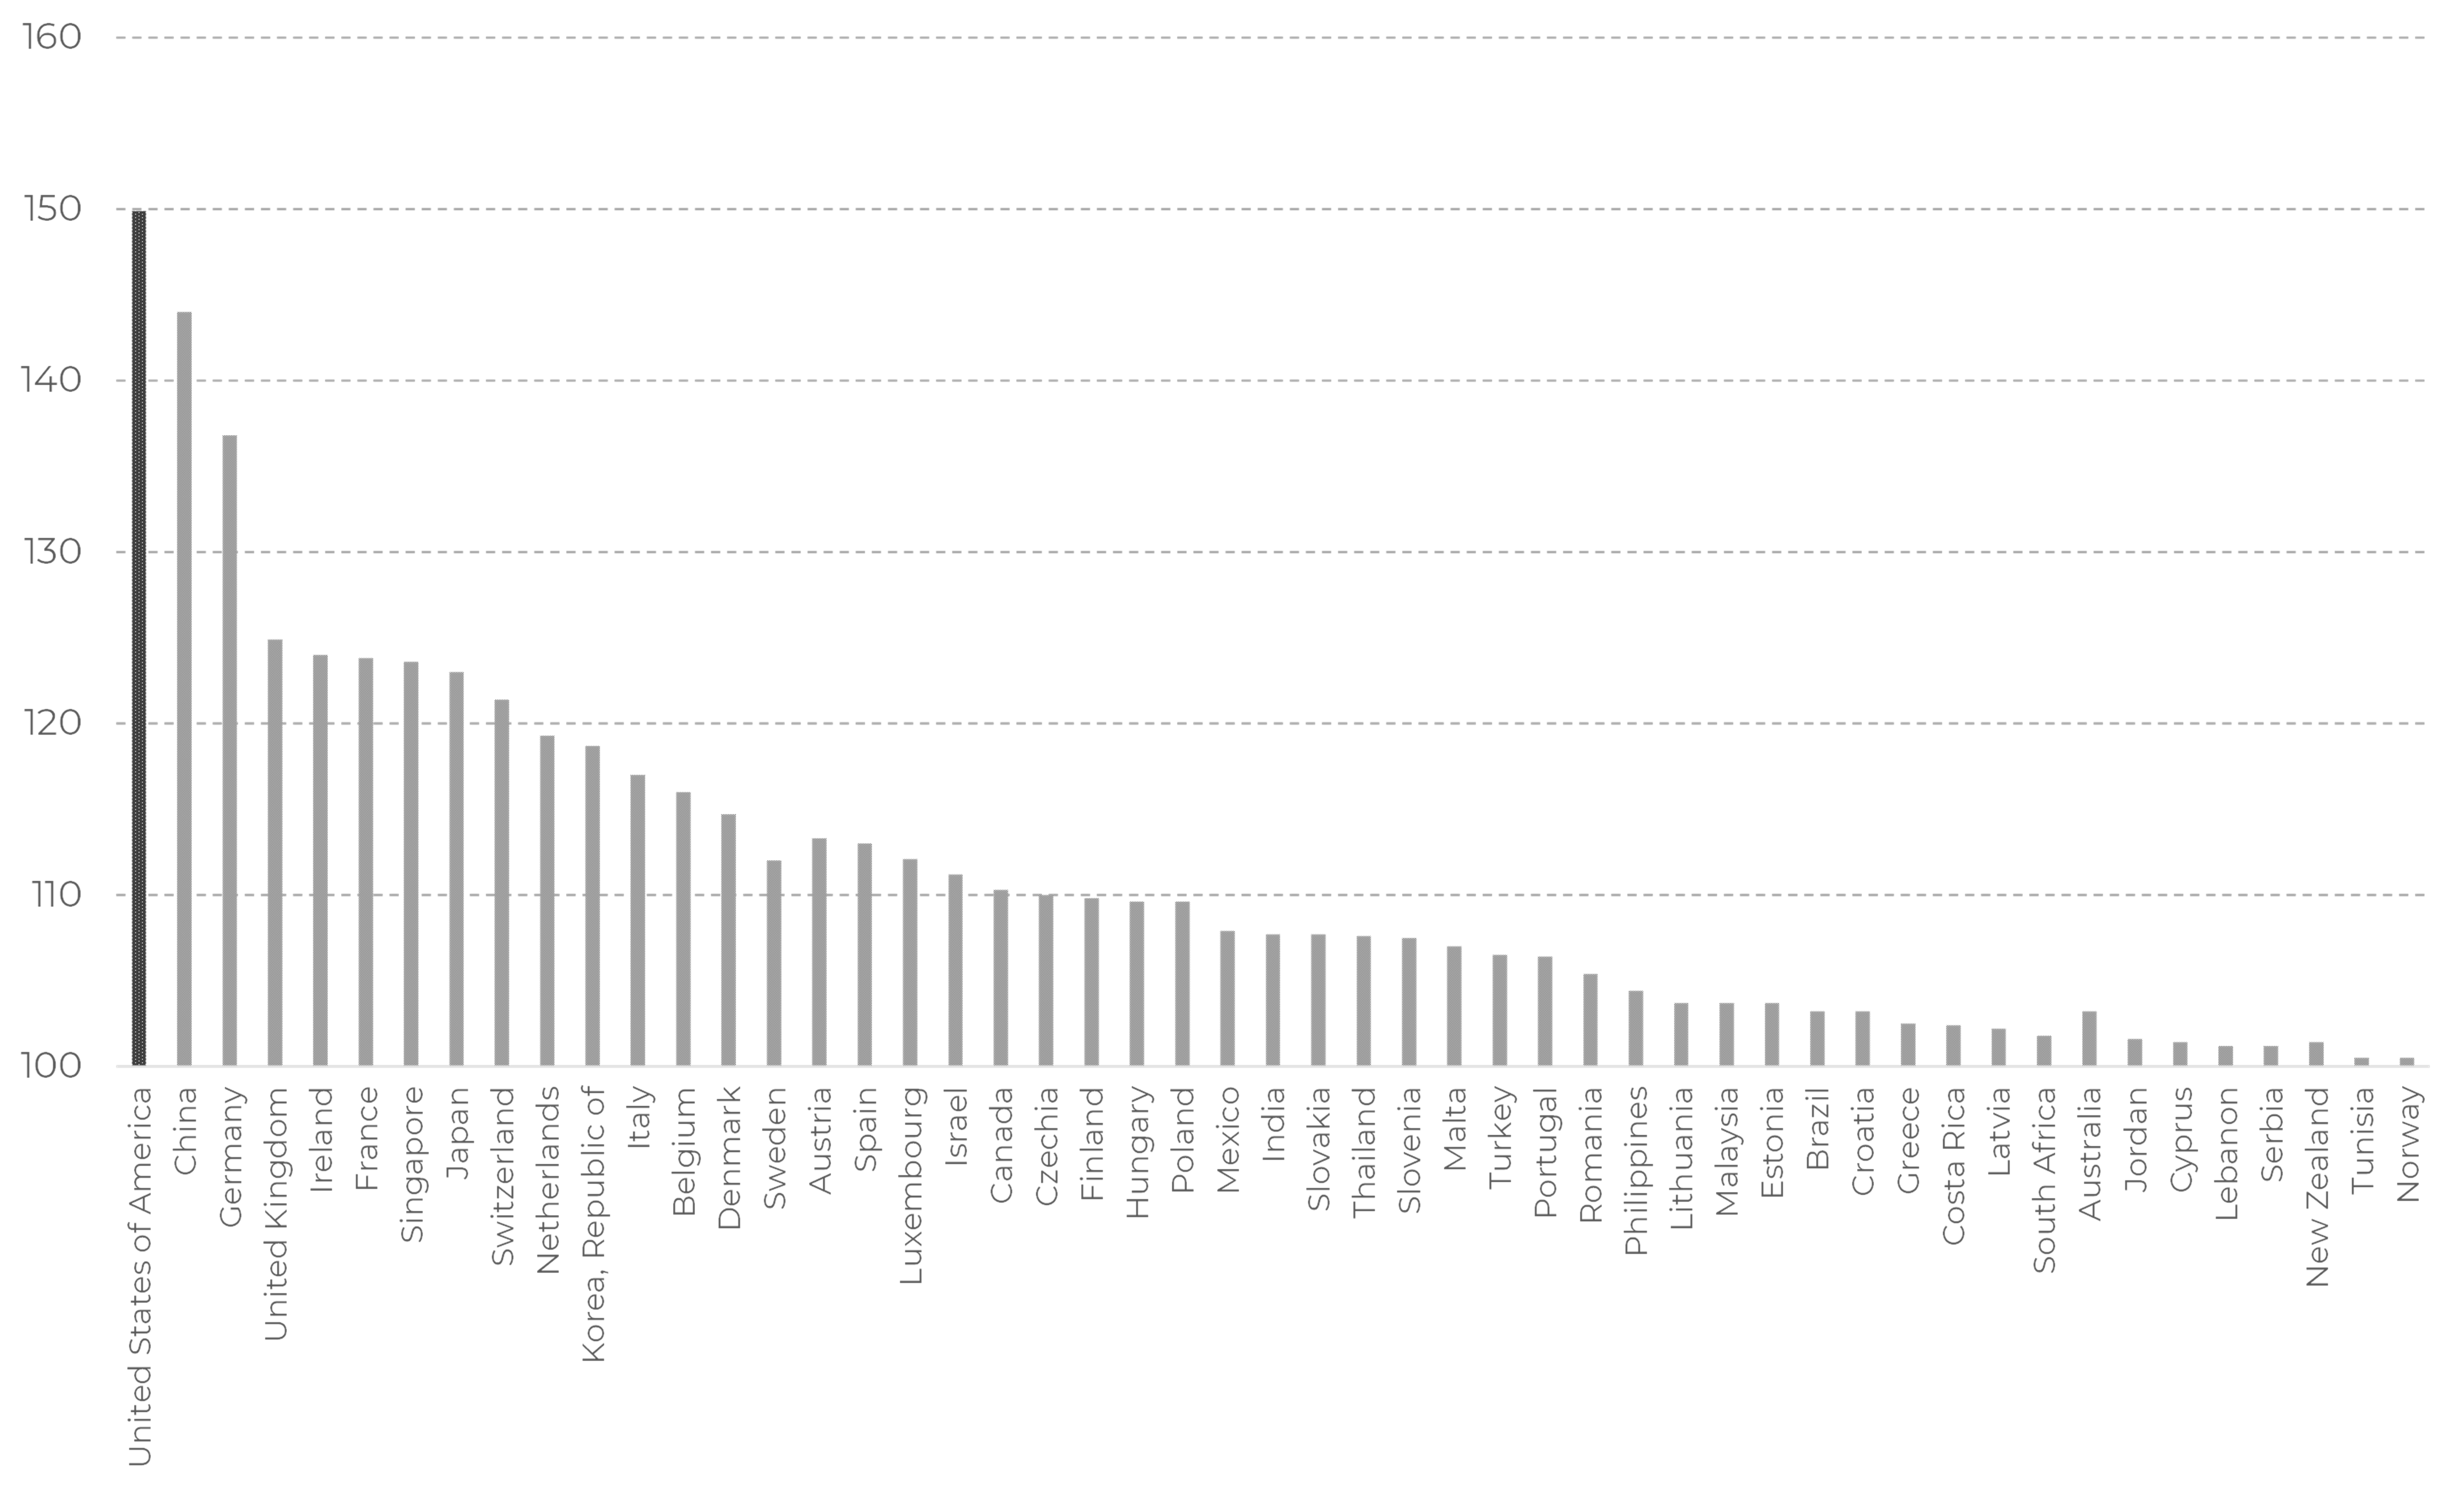
Figure 5 . Global Economic Diversification Index by Country, 20232
Another part of the explanation is the debt holders’ structure. According to Figure 6, the net debt figure, adjusted for passive investors – BoJ and pension funds (including life insurance) – is close to 80% of GDP which does not look as disastrous as the gross 260% gauge.
Concerning the US, the surge in borrowing is a flipside of the Fed’s balance sheet increase. In 2020 it was the Treasury Department that financed population and businesses to help them overcome the lockdown. The Fed, in turn, financed the Treasury Department through the purchasing of bonds from the market. So, the country borrowed issued money from itself with the Fed being an ultimate rescue lender. As a result, the net US government outstanding debt, adjusted for the Fed holding, still stands close to 90% as it did before COVID.
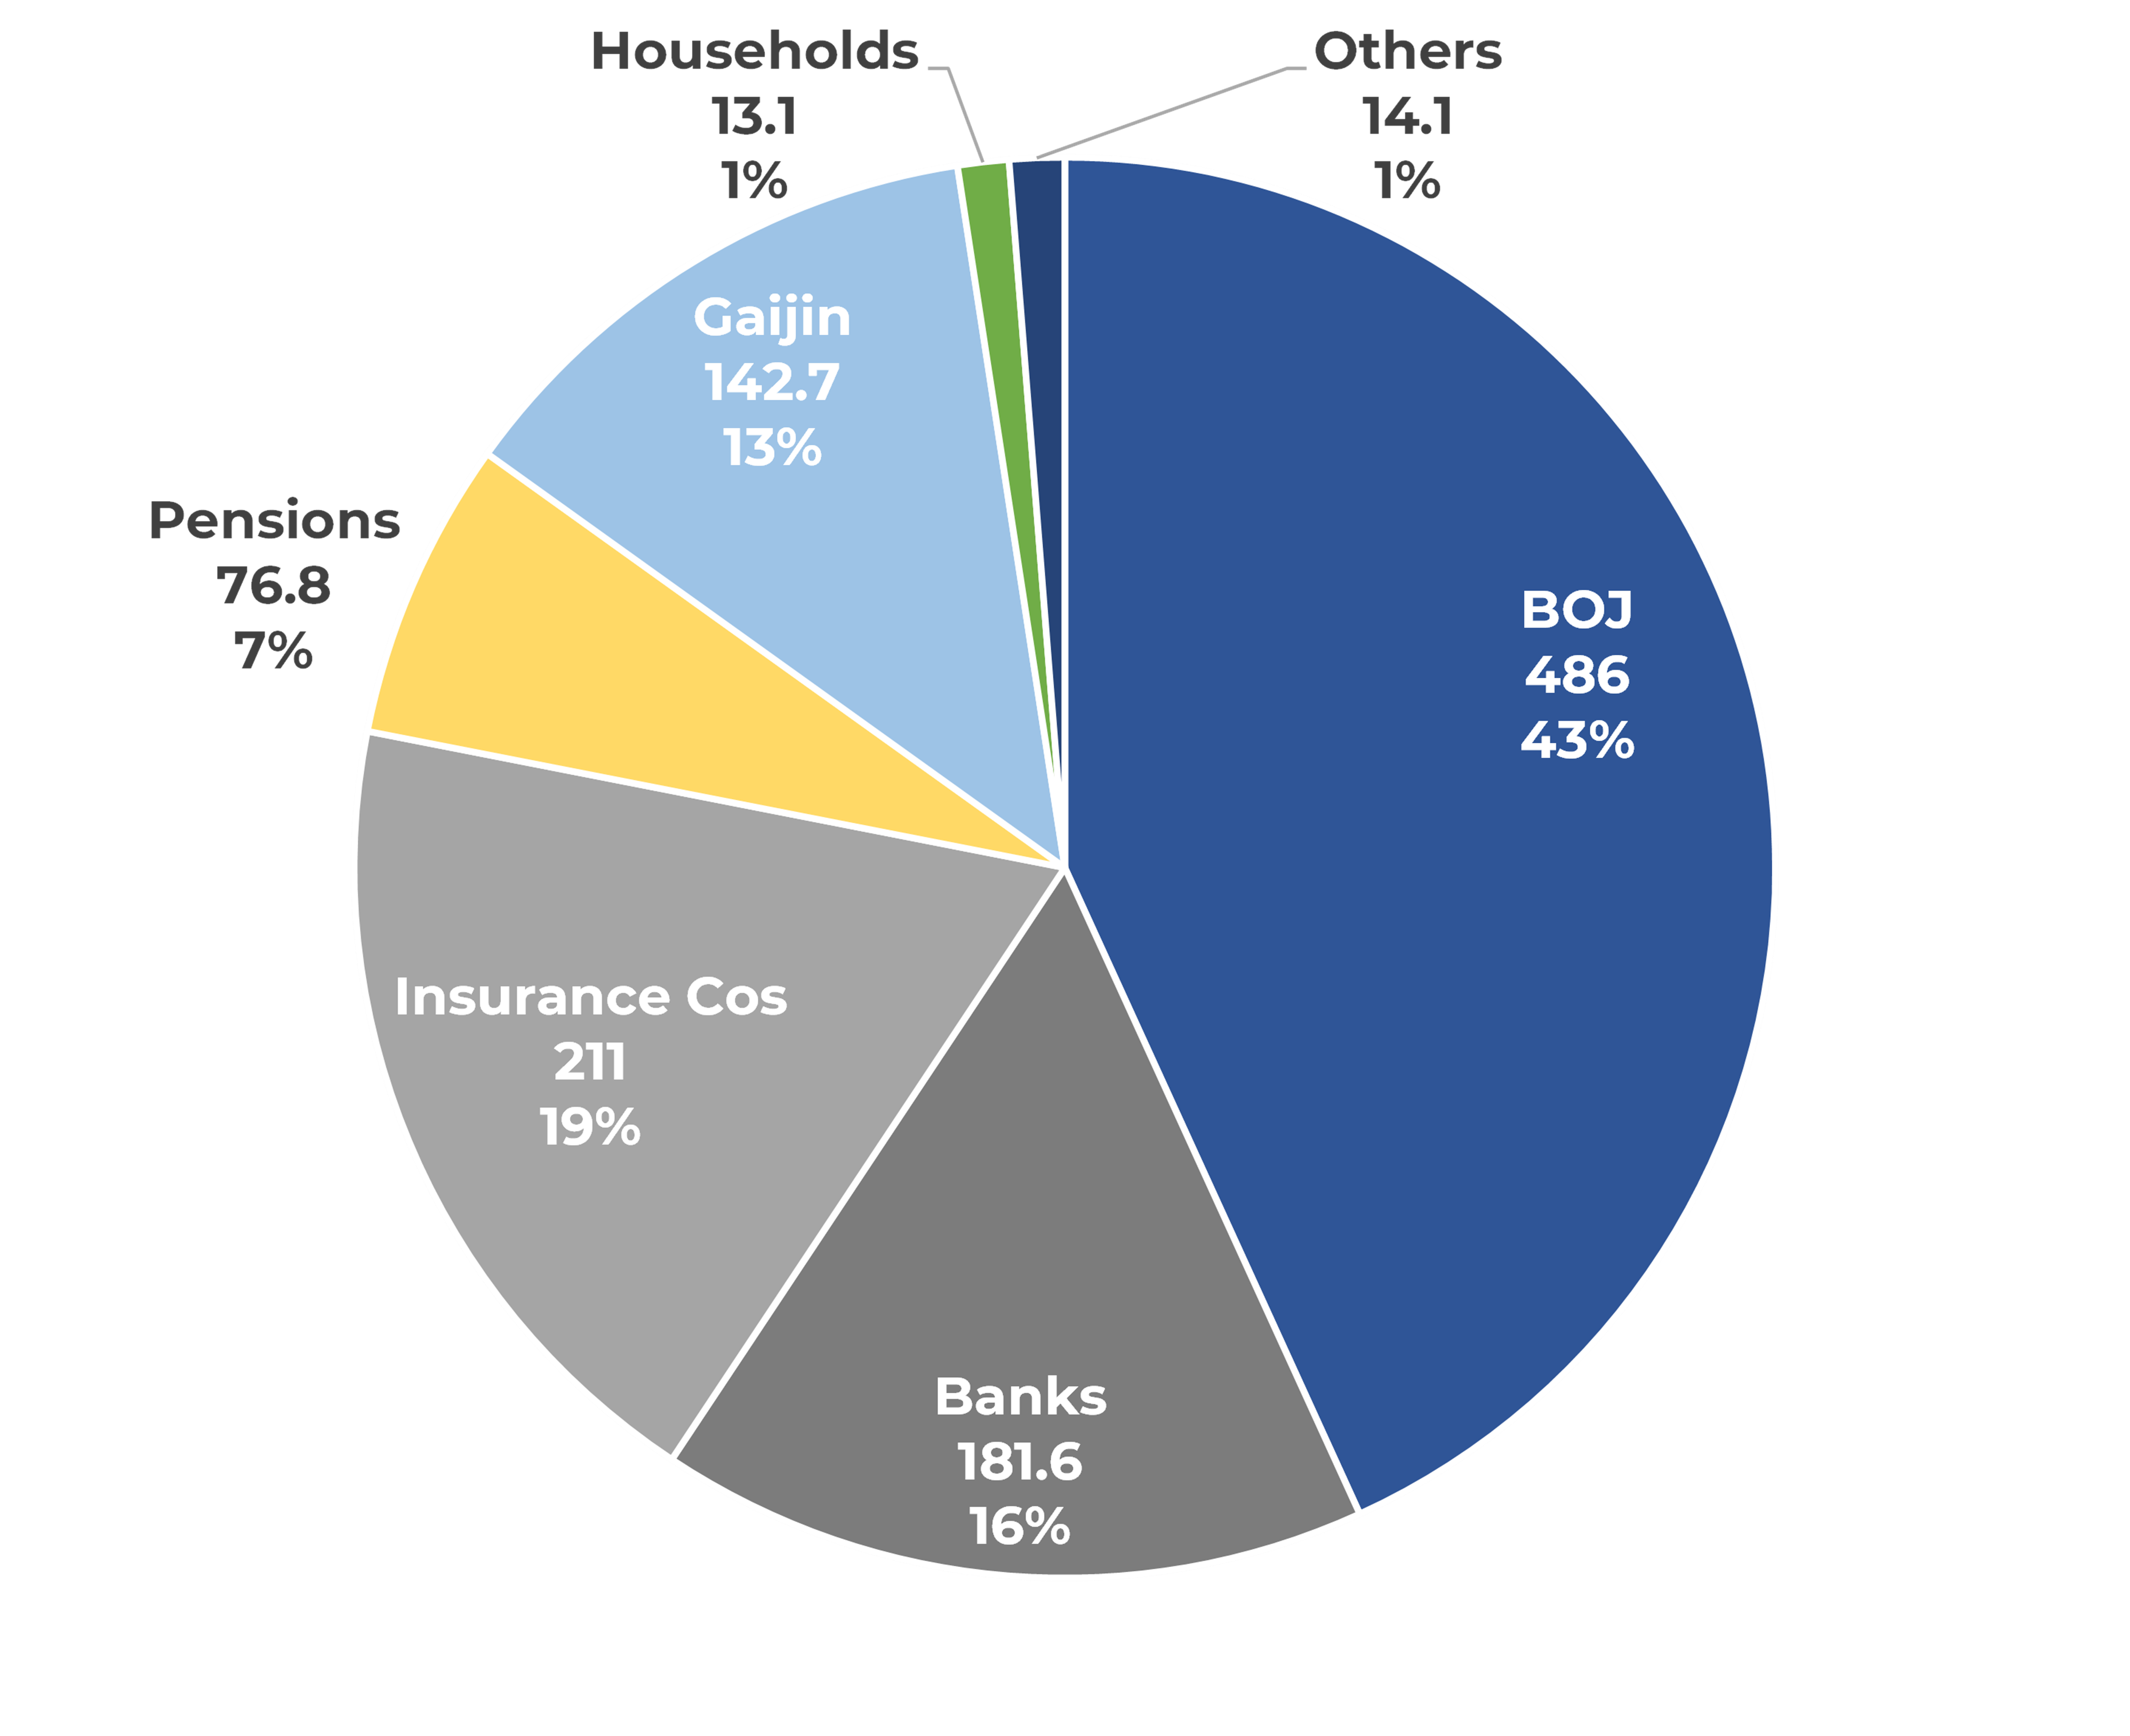
Figure 6
. Japanese Government
Bond and t-Bill Holders, tr yen (March 2019).
Source: South China Morning Post, Bank of Japan
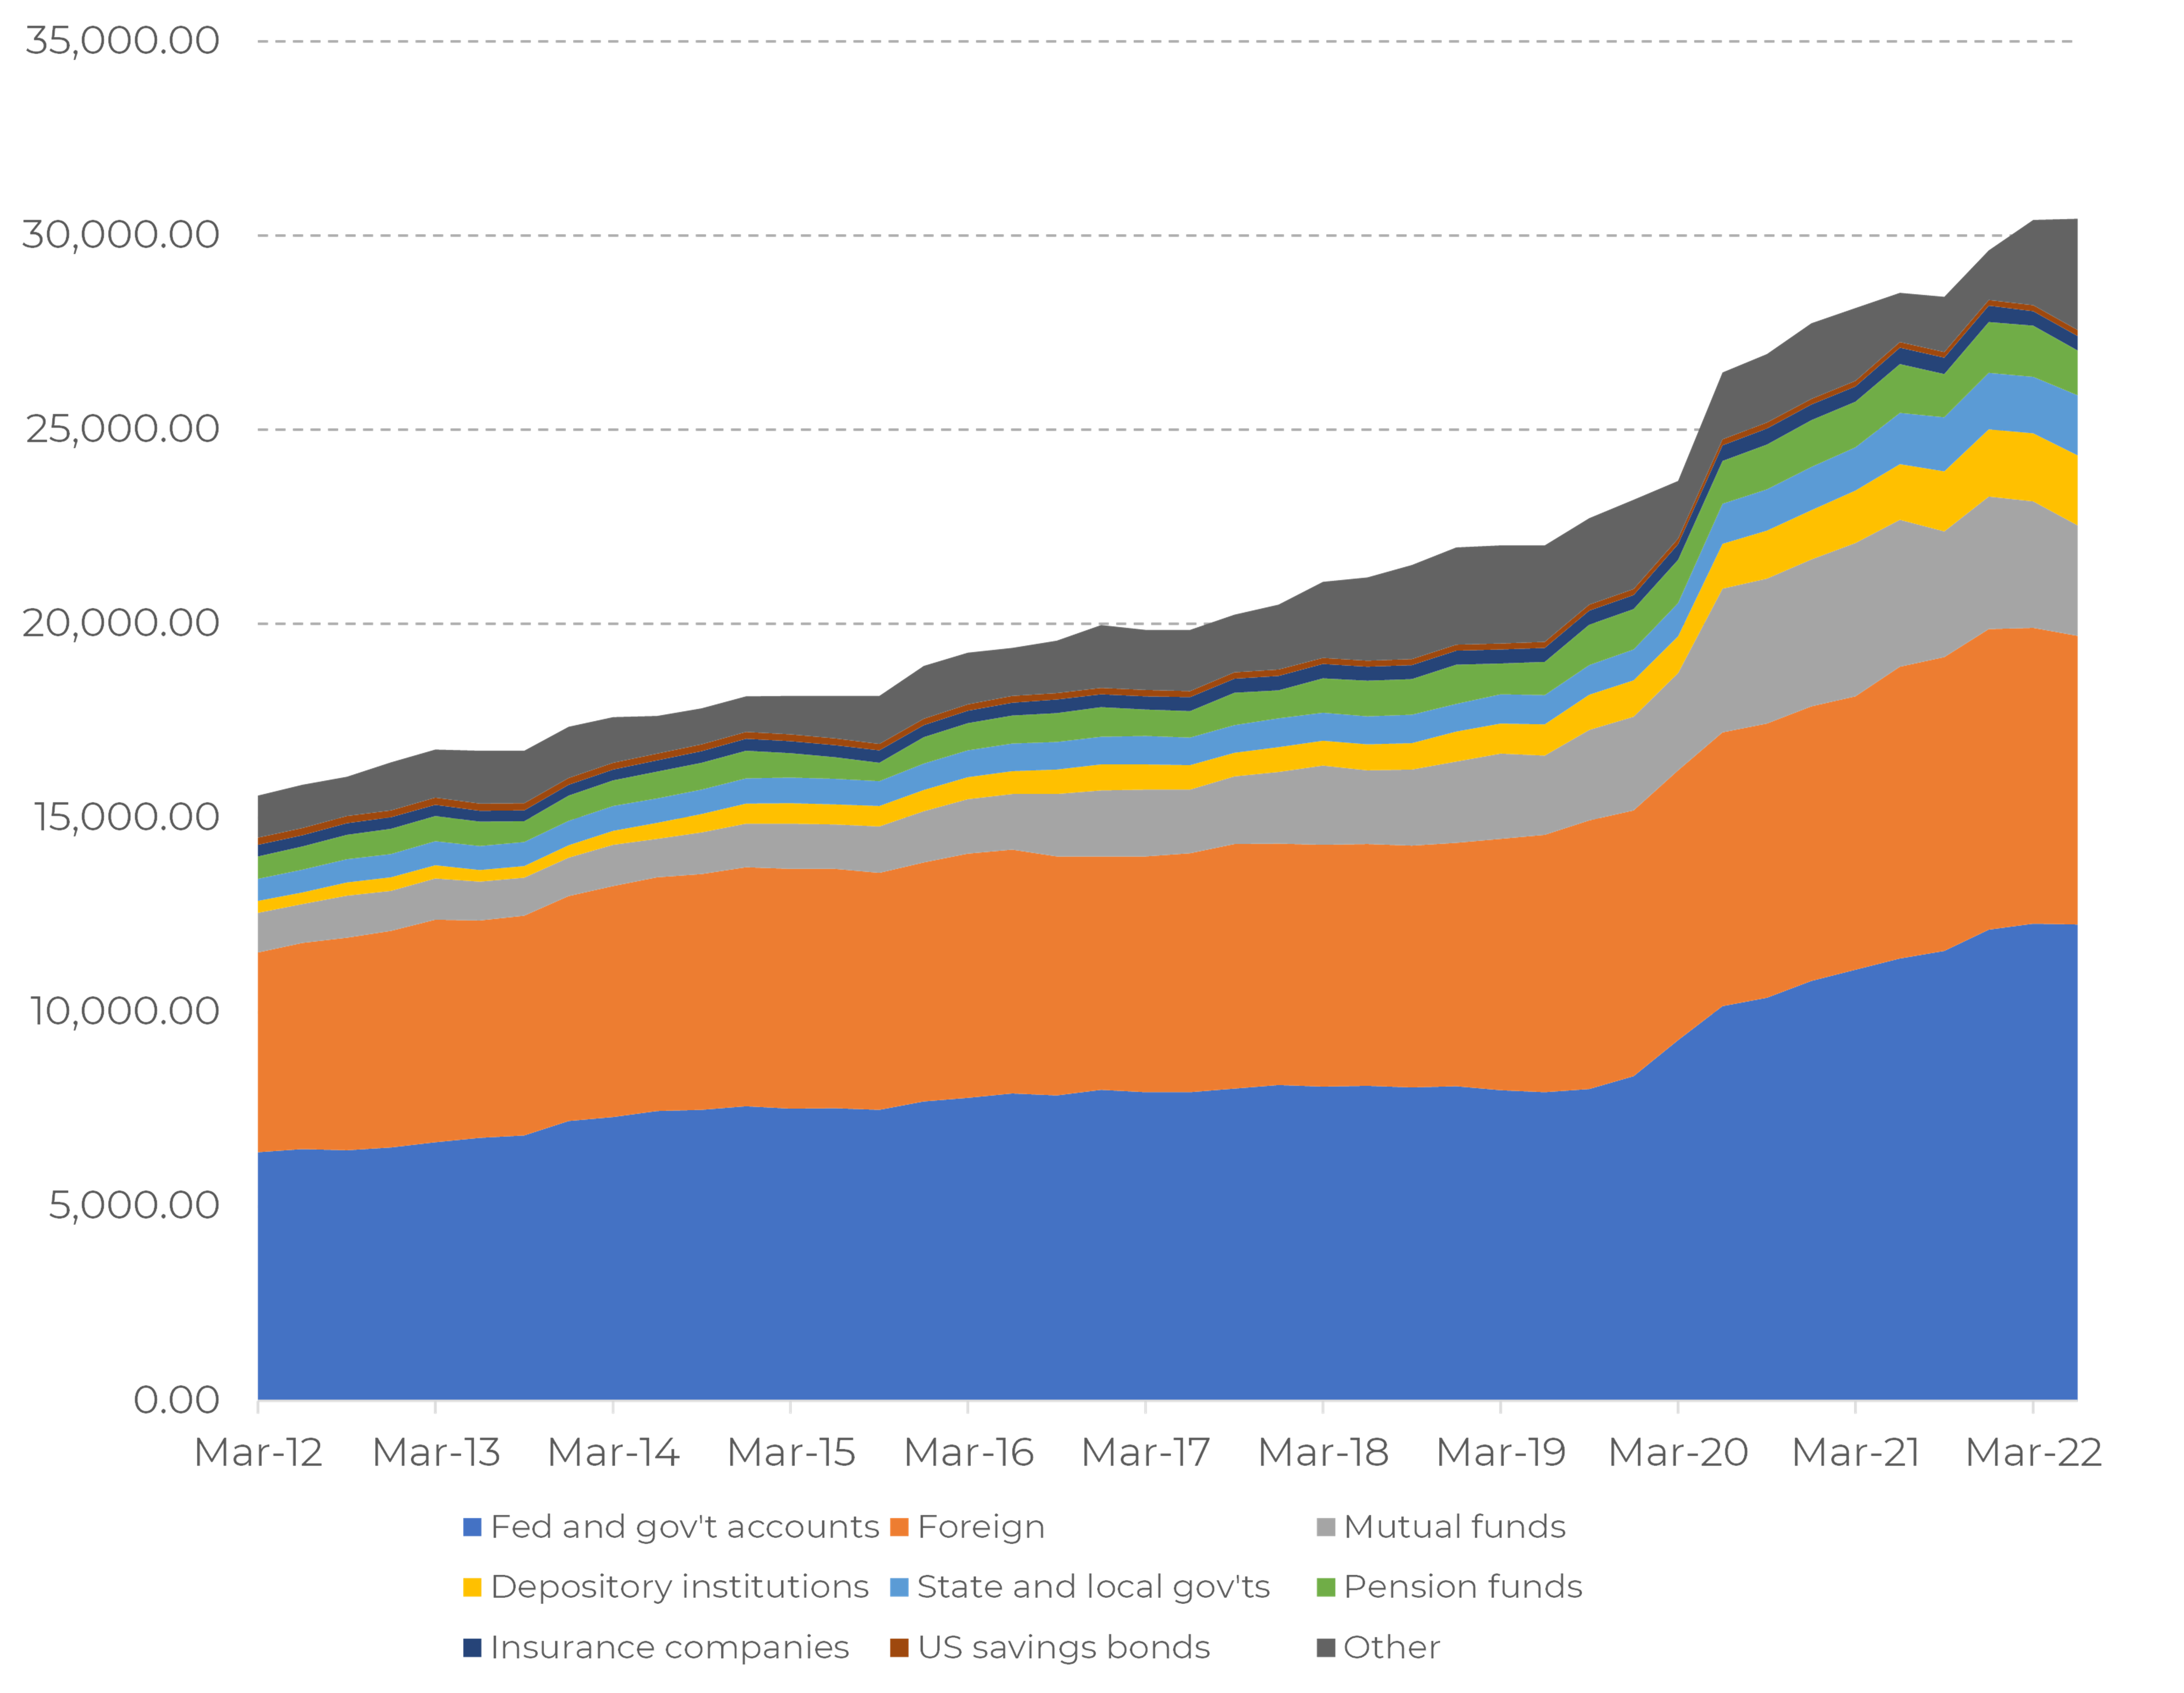
Figure 7. US Treasury bonds holders. Source: Treasury department
|
Year |
US Gross Debt |
US Fed holding |
GDP |
Adj. Debt/GDP |
|
2019 |
23.2 |
4.1 |
21.7 |
88% |
|
2022 |
31.4 |
8.6 |
26.1 |
87% |
The Fed, however, is not intended to keep the bonds on its book forever and started reducing its position selling up to $60 billion per month3 . For the Fed it is a necessary part of its fight against inflation. Doing so, the Federal reserve is trying to reallocate its anti-pandemic expenses onto the government.
Thus, we have two sources of bonds’ supply: the Treasury Department and the Federal Reserve.
On top of that, the foreign holdings were also hit in mid-2022. China and especially Japan were forced to protect their currencies with yen devalued against dollar by 50% by October 2022. Currency protection means nothing but selling their reserves, mainly US bonds, by central banks.
At last, under sellers’ pressure, US 30Y bonds broke their forty-year long channel. Against this background investors lost ground under their feet.
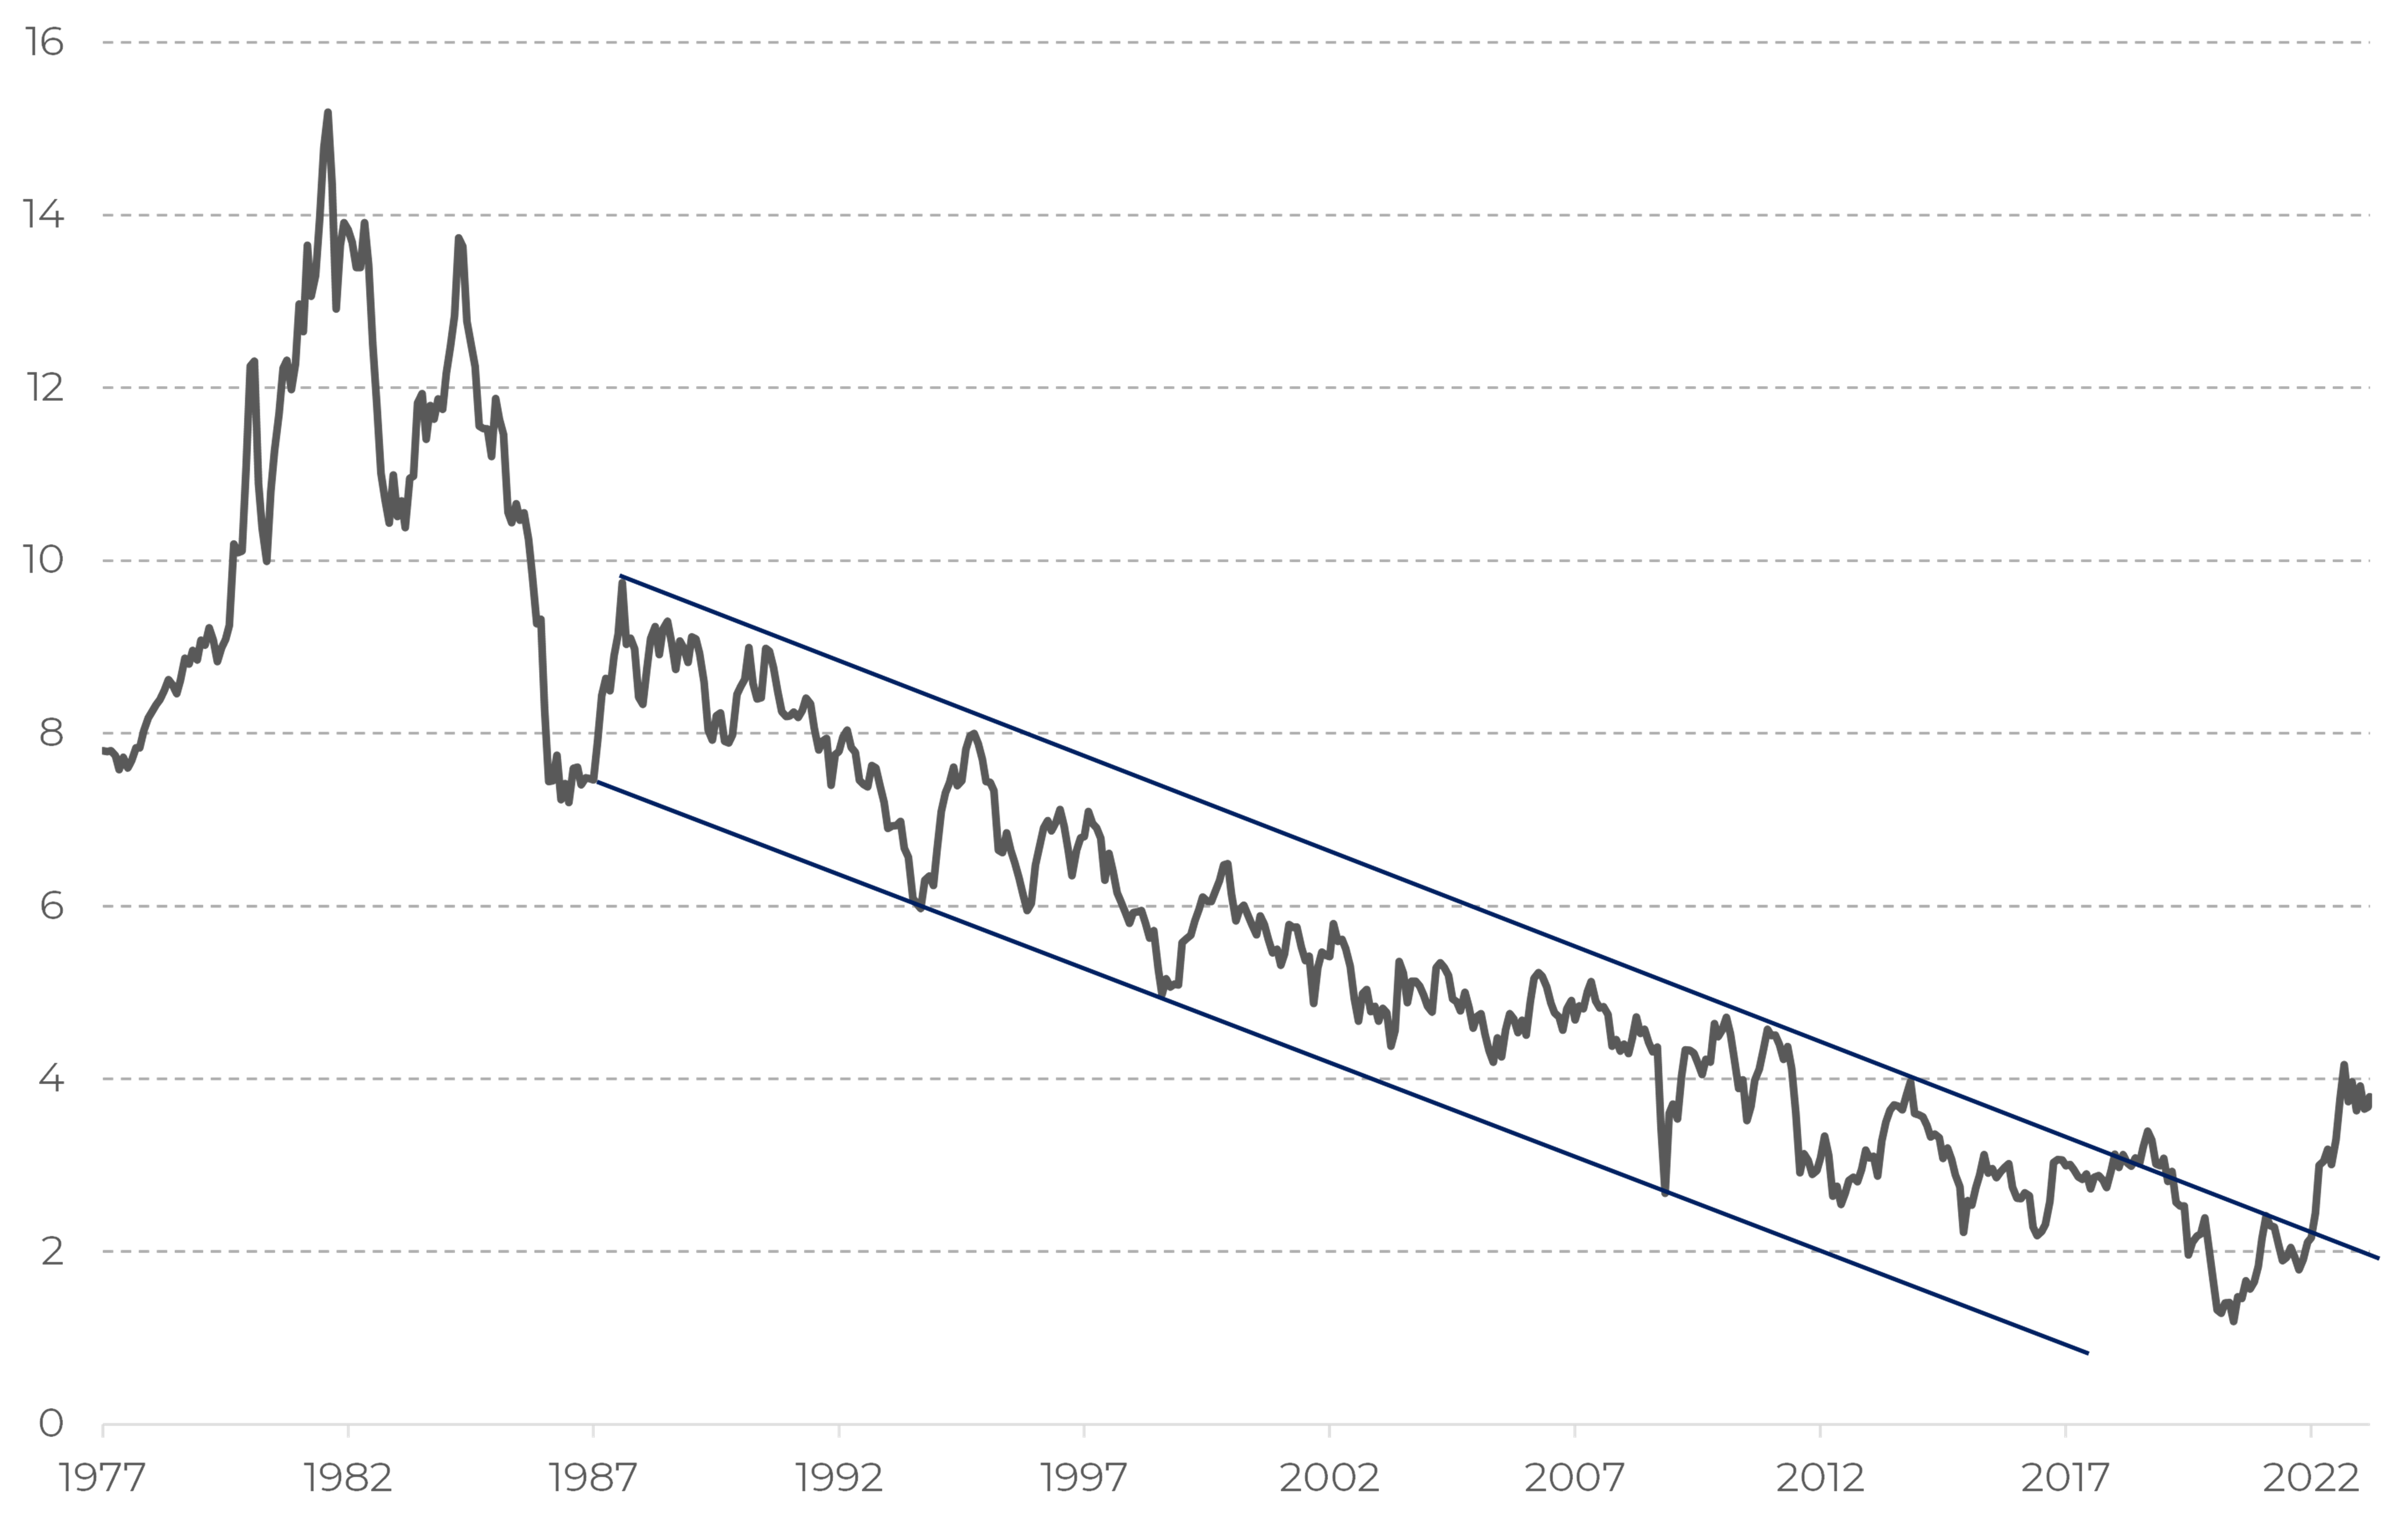
Figure 8 . US 30Y government bonds yield. Source: Bloomberg
The combination of these factors resulted in the most dramatic fall of US bonds prices over the past 50 years.
There is an opinion that the major driver for the US bonds is the surging inflation. We would cast doubt on this thesis since even a 30% price hike would lead to 1% higher yields over the 30Y horizon. Now that inflation is going down it is getting harder to justify the current yields level based on this factor.
The current yield level can be seen as fair if only one expects inflation to stay with us for long. This does not look probable considering the fight the Fed is conducting against inflation. The money in circulation is contracting setting a natural limitation for the further price rise.
Now let us get back to the Fed: it is worth highlighting that fighting inflation is good for the bond market, but one of the Fed’s tools is selling bonds which is bad. So, let us dig deeper into the Fed’s intention on the matter.
Having bought bonds into its portfolio, the Fed issued new money. Whoever the ultimate money receiver is, he is holding it in a bank account. The US banking system, therefore, has become overloaded with huge piles of cash.
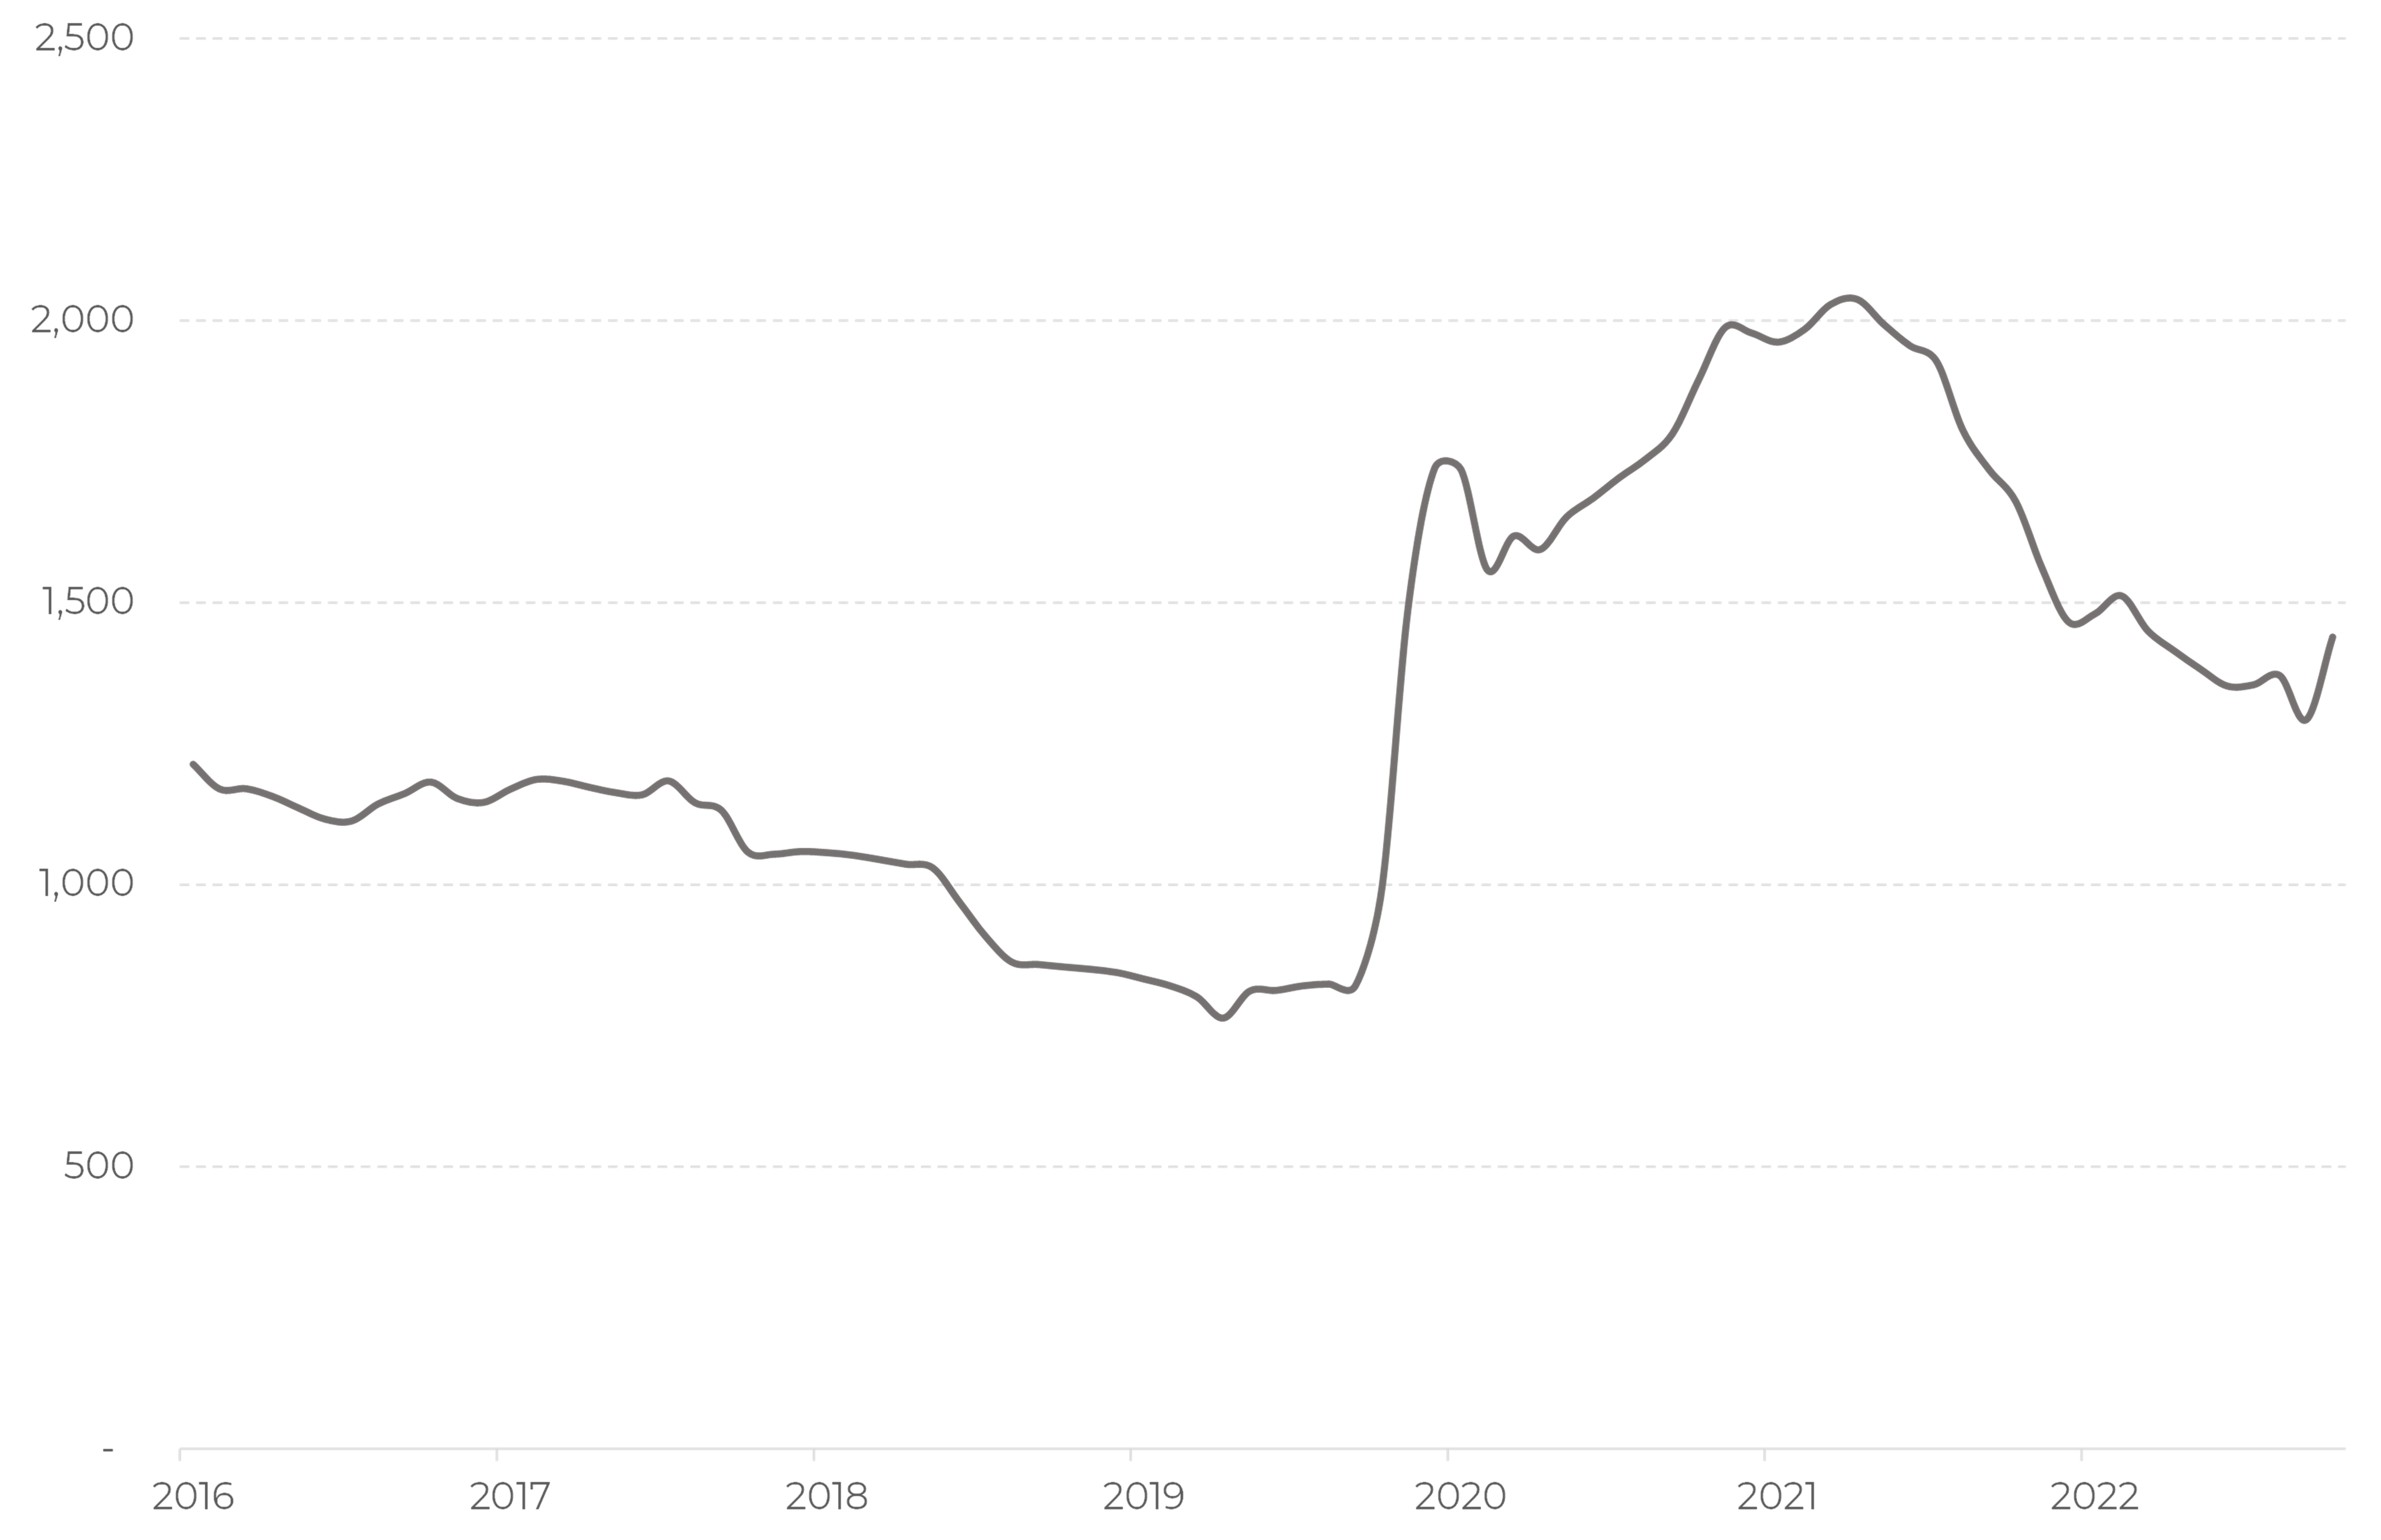
Figure 9 . US largest banks’ cash position. Source: Bloomberg
Before a bank provides this cash in the form of a loan to anyone, this money stays out of circulation, not putting extra pressure on prices. Raising the key rate above 5%, the Fed ‘locks’ this banks’ money in its own accounts.
While this money is locked, the Fed is selling bonds reducing the banks’ cash position. Its objective is to drive the banks’ cash position to a neutral level ahead of the upcoming monetary easing. This protects the economy from a hyperinflation risk.
According to what we see on Figure 9, it will take about a year to return the banks’ cash to the pre-pandemic level. The Fed’s chief J. Powell has not pointed out to any specific criteria of when the bonds sale should stop.
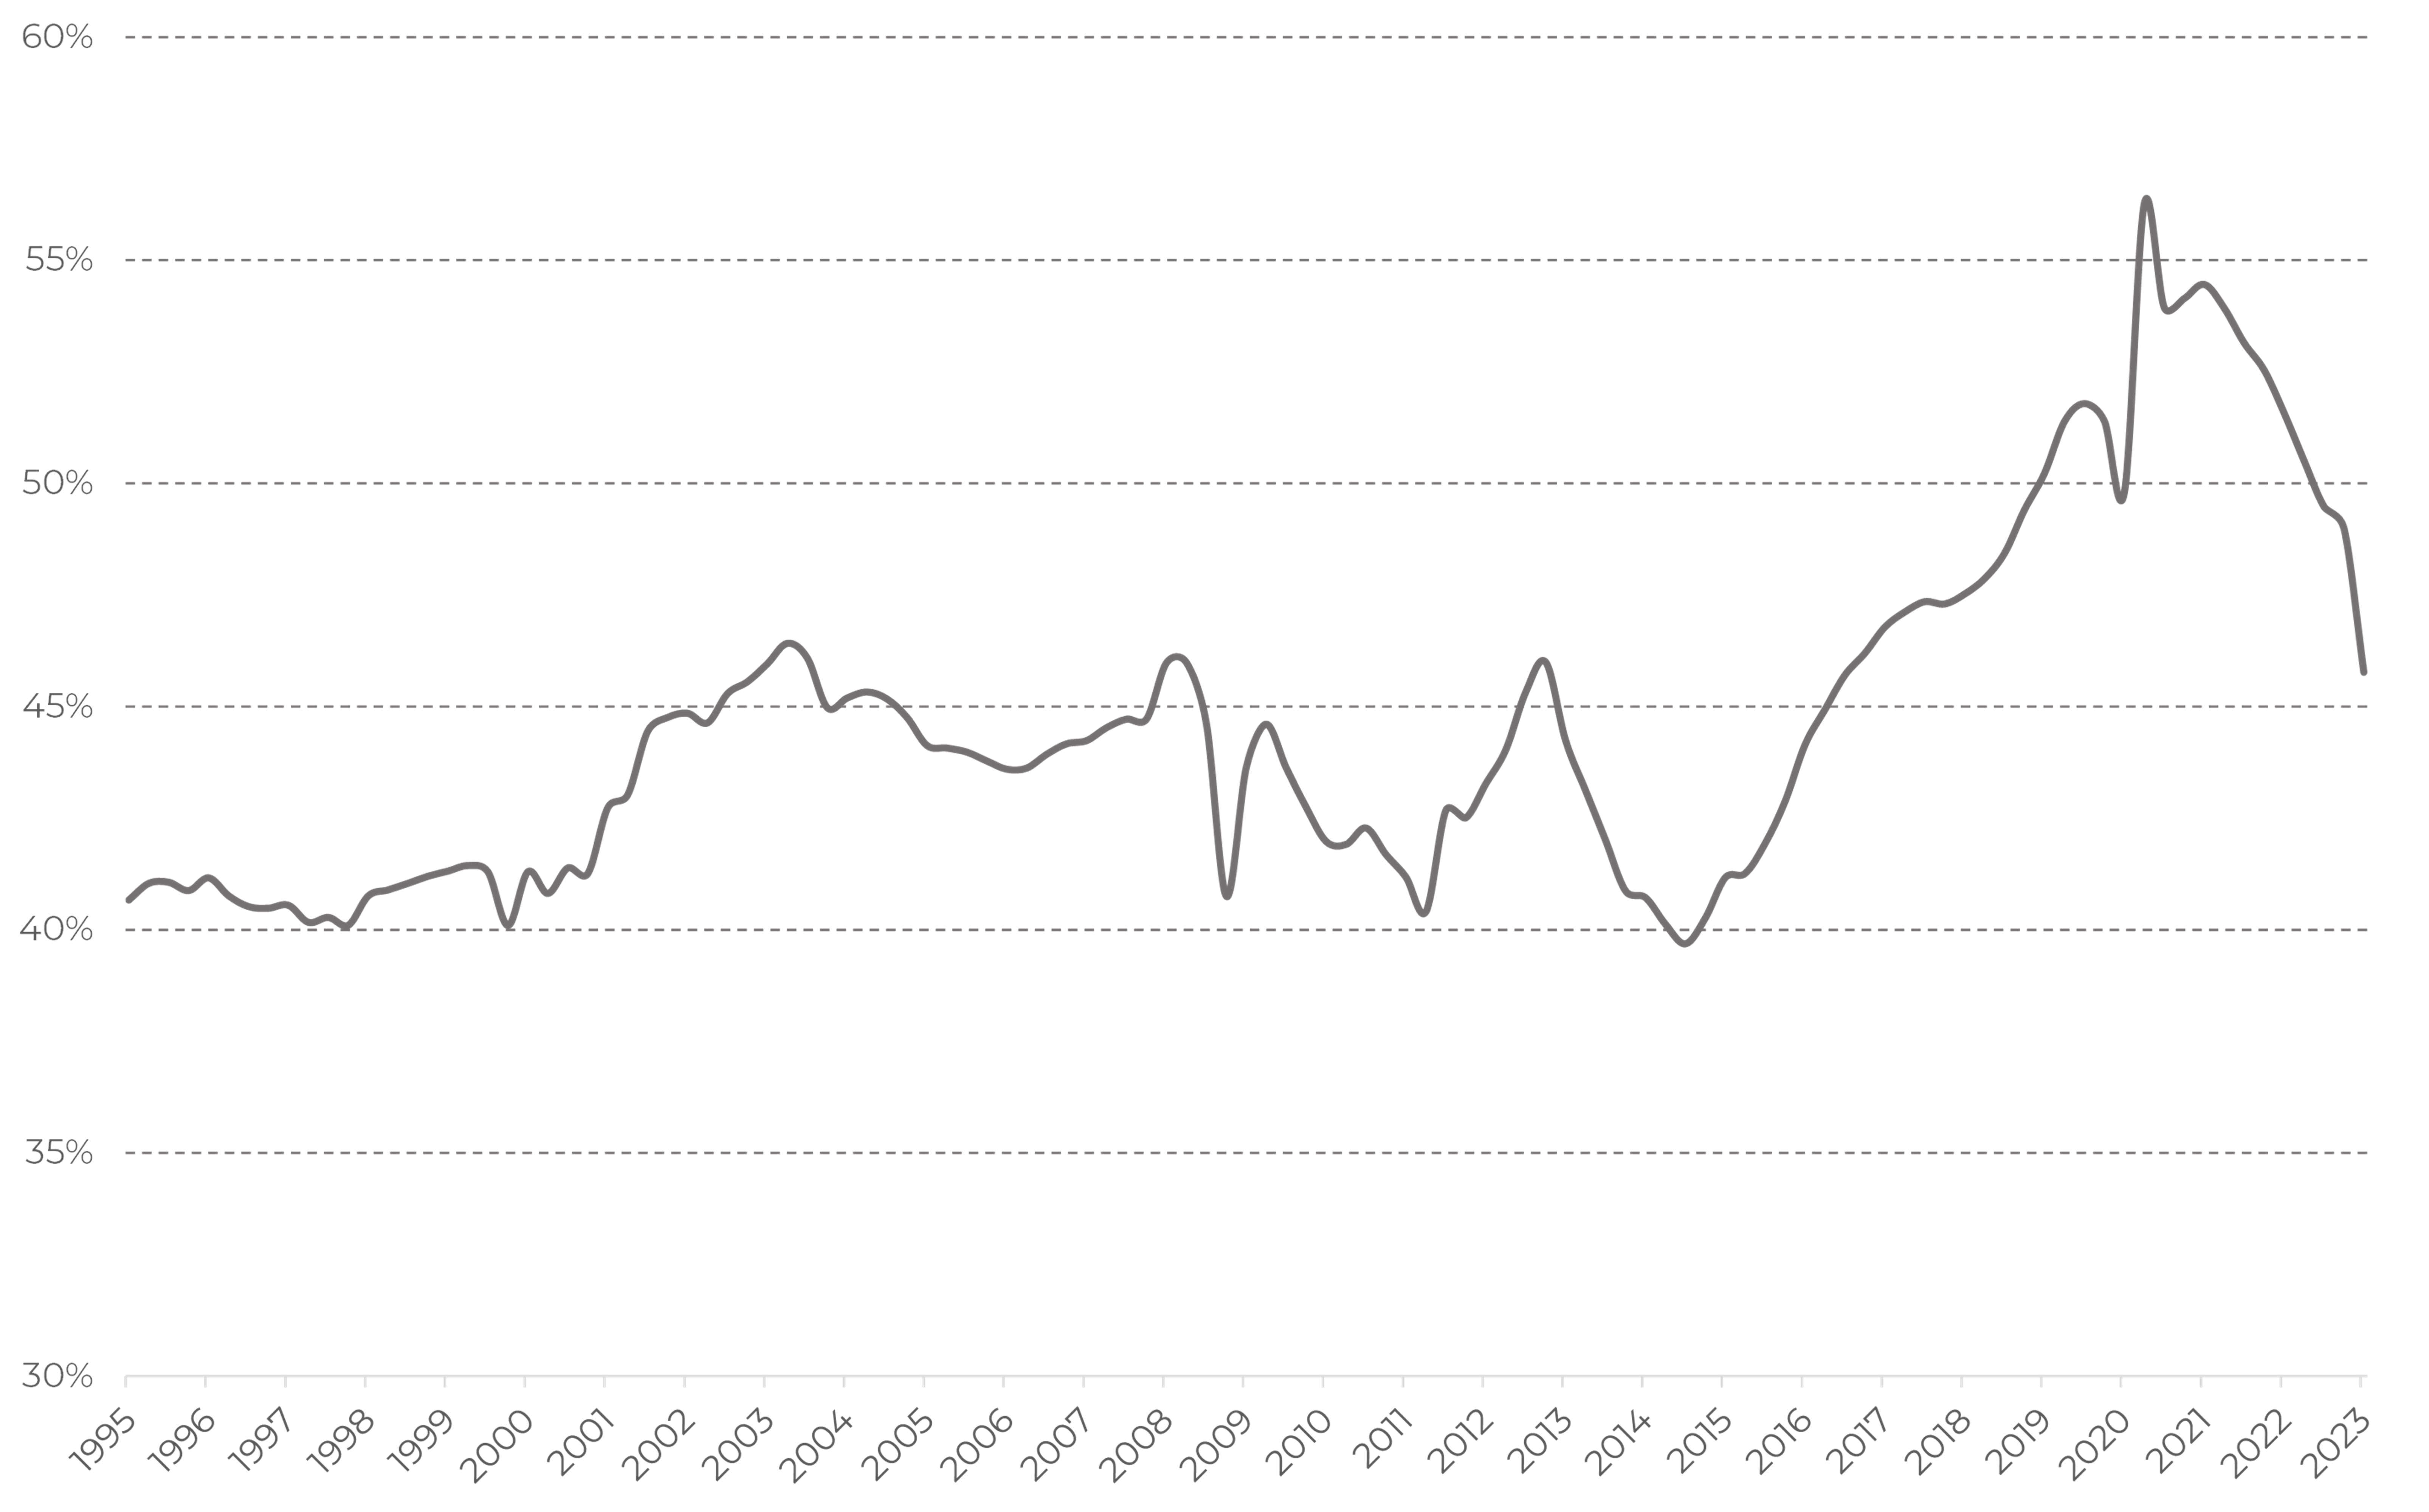
Figure 10 . M2 (adj. for the Fed's balance sheet) to GDP ratio
It is worth noting that the excess of money in the economy, which is one of the most major drivers causing inflation, is already close to its neutral level, according to Figure 10.
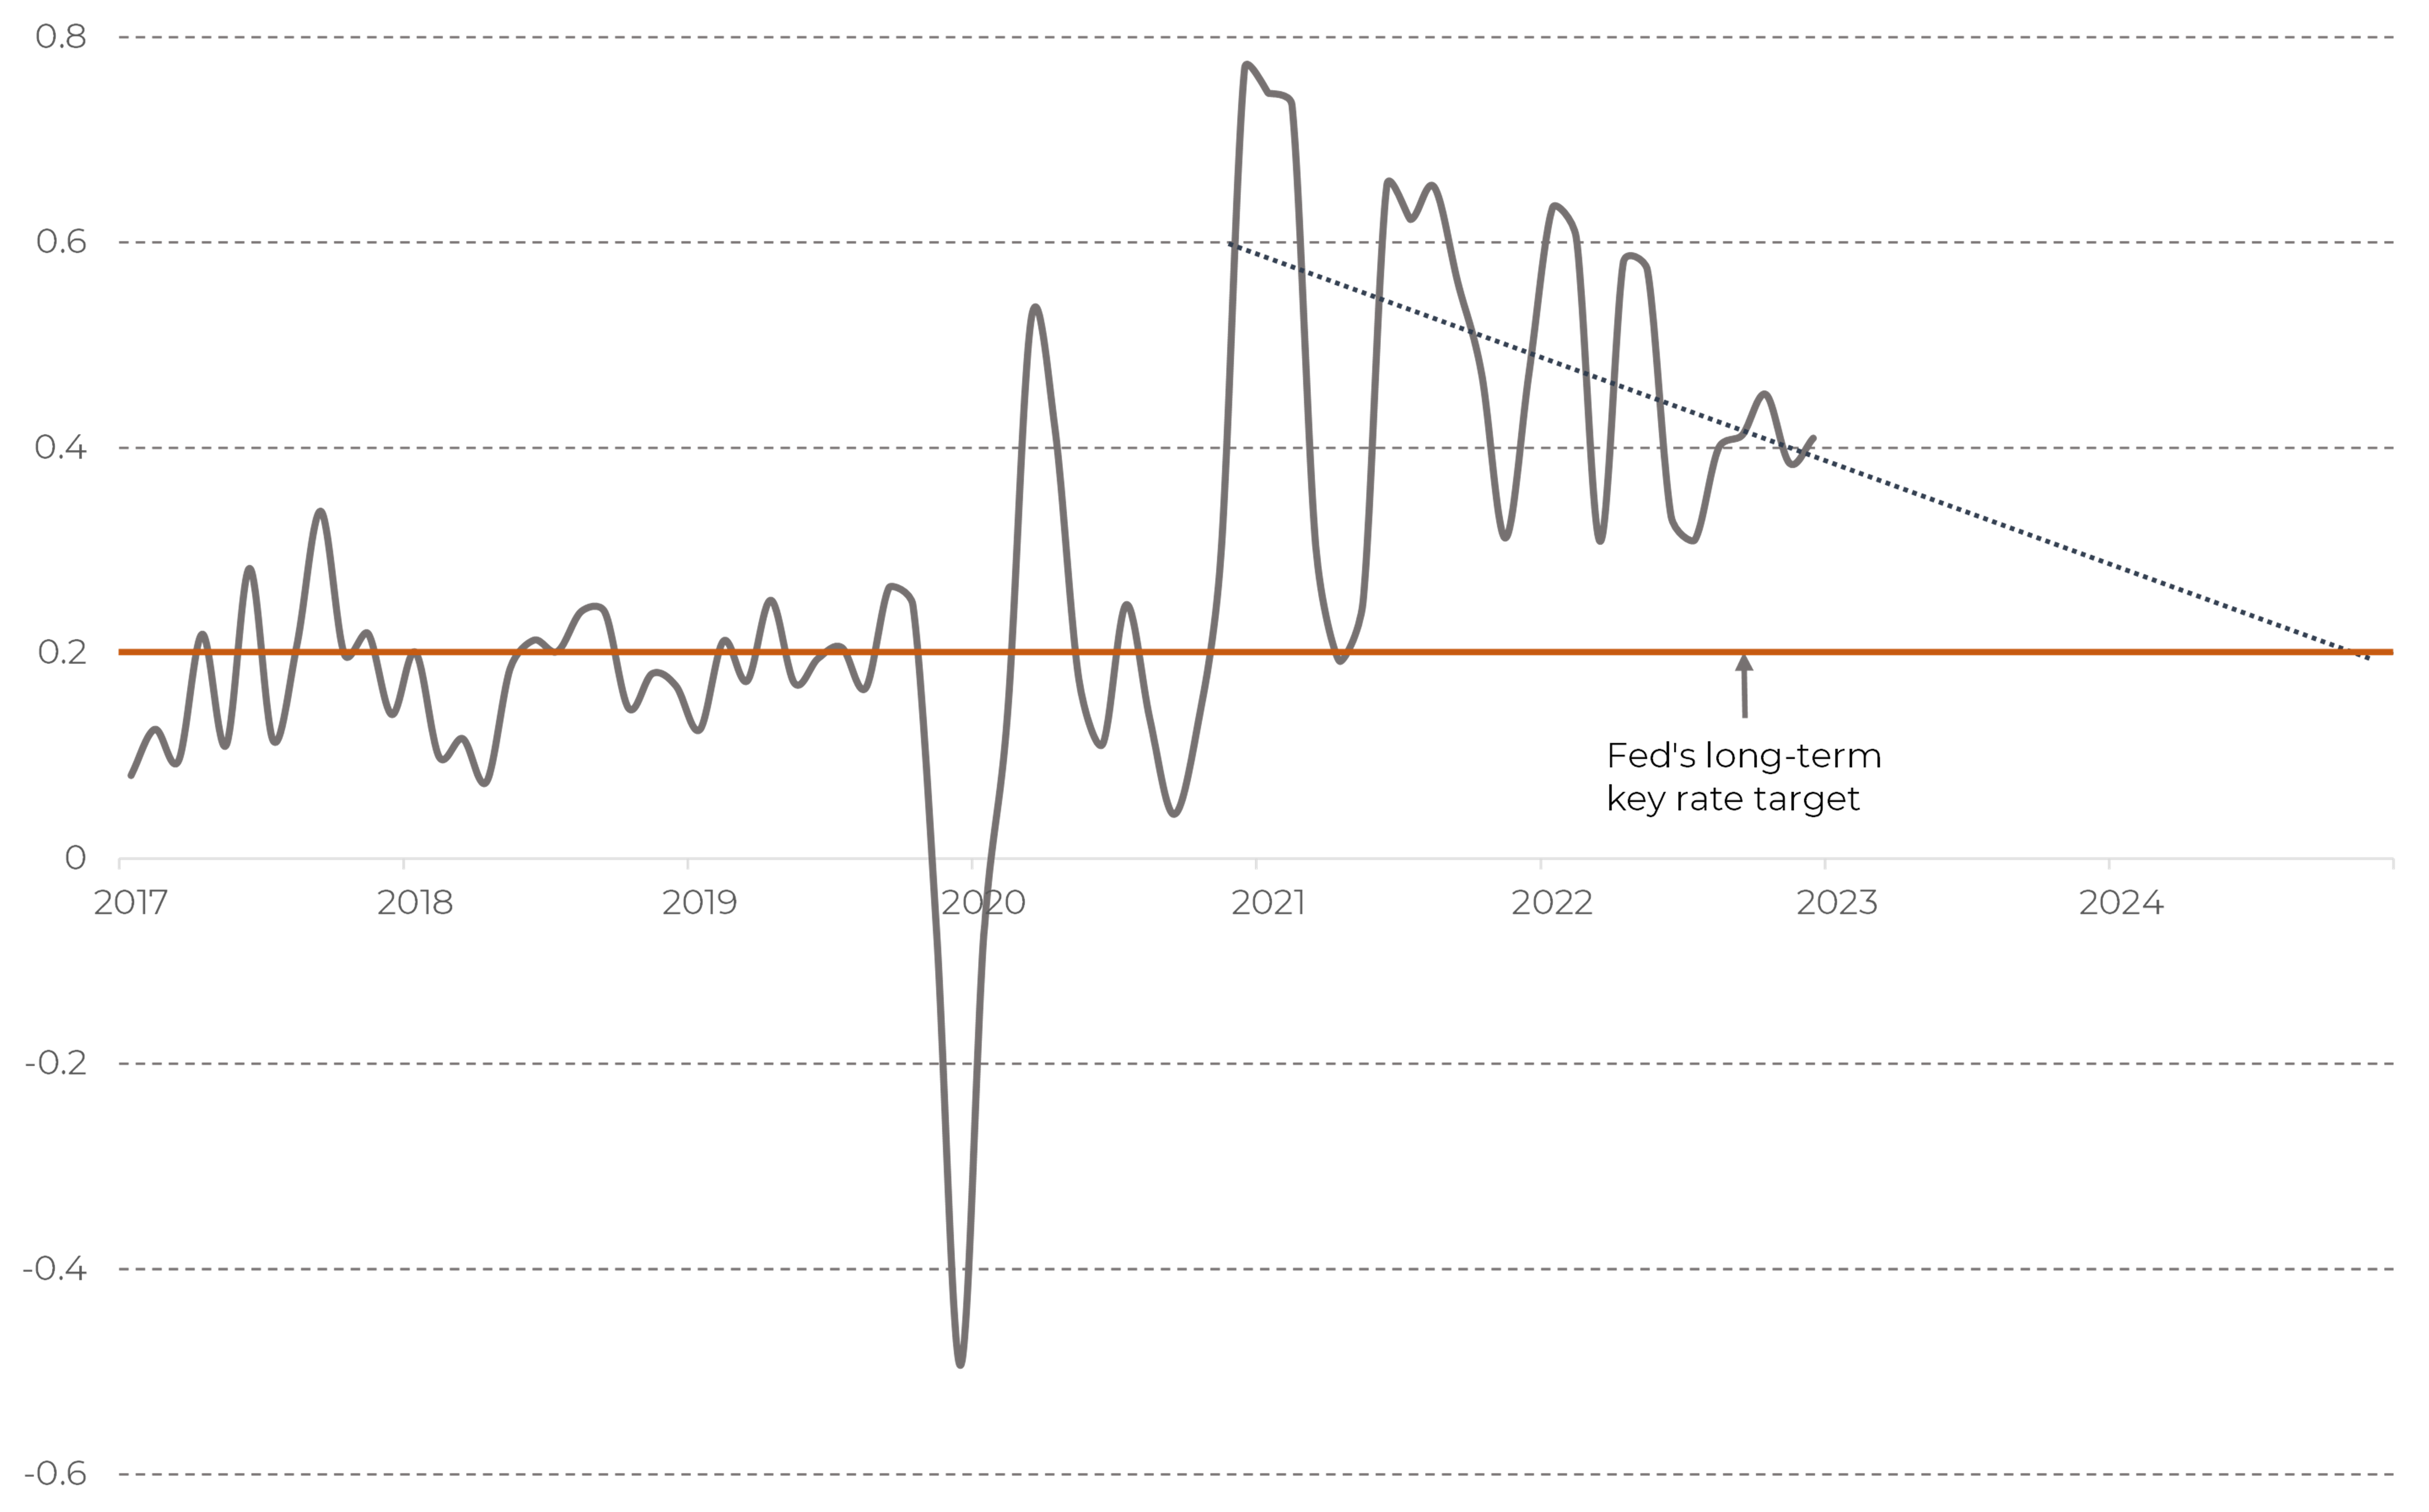
Figure 11 . US core CPI, MoM
Monthly inflation gauge, as the regression line on Figure 11 shows, is moving in the right direction pointing to 2024 when inflation is going to cease to be an issue. If so, within a one-two years horizon the bond market will return to its pre-pandemic level providing a once in a lifetime opportunity for bondholders.
To sum up, we do not see that the current US Treasury bonds yield is a result of long-term inflation projection. From our point of view, the behavior of the bond market is dictated by two opposite factors:
· Attractive yield level which encourages to expect double-digit returns,
· Temporary oversupply of bonds
US bond market from a federal budget point of view
In 2022 the US budget received 4.9 trillion dollars of revenue and spent 6.3 trillion dollars. Budget deficit is a general state of the US financial system. It raises a question how stable can such a system be and where is the critical point of this policy?
The equation is quite simple: a country can hold a negative balance of its budget until the debt/GDP ratio gets critical.
A stable debt/GDP ratio implies that the debt can grow while GDP is going up. GDP, in turn, grows because of economic growth and inflation. Now inflation is a major driver providing circa 5% contribution in the US GDP change. Economic growth (which is nothing but a real GDP growth) is about 1%. That drives us to 6% of the nominal GDP growth, which allows the US to raise its debt by the same 6%. With current US federal debt level about 30 trillion dollars, this ‘neutral’ debt growth comes in at 1.8 trillion dollars.
The interest payments in 2022 totaled 724 billion dollars which is almost 200 billion dollars higher than before pandemic, but still significantly lower than the total budget deficit of 1.4 trillion dollars. It is quite a typical situation: the US Government issues a new debt to cover interest payments and almost always borrows even more to cover other spendings.
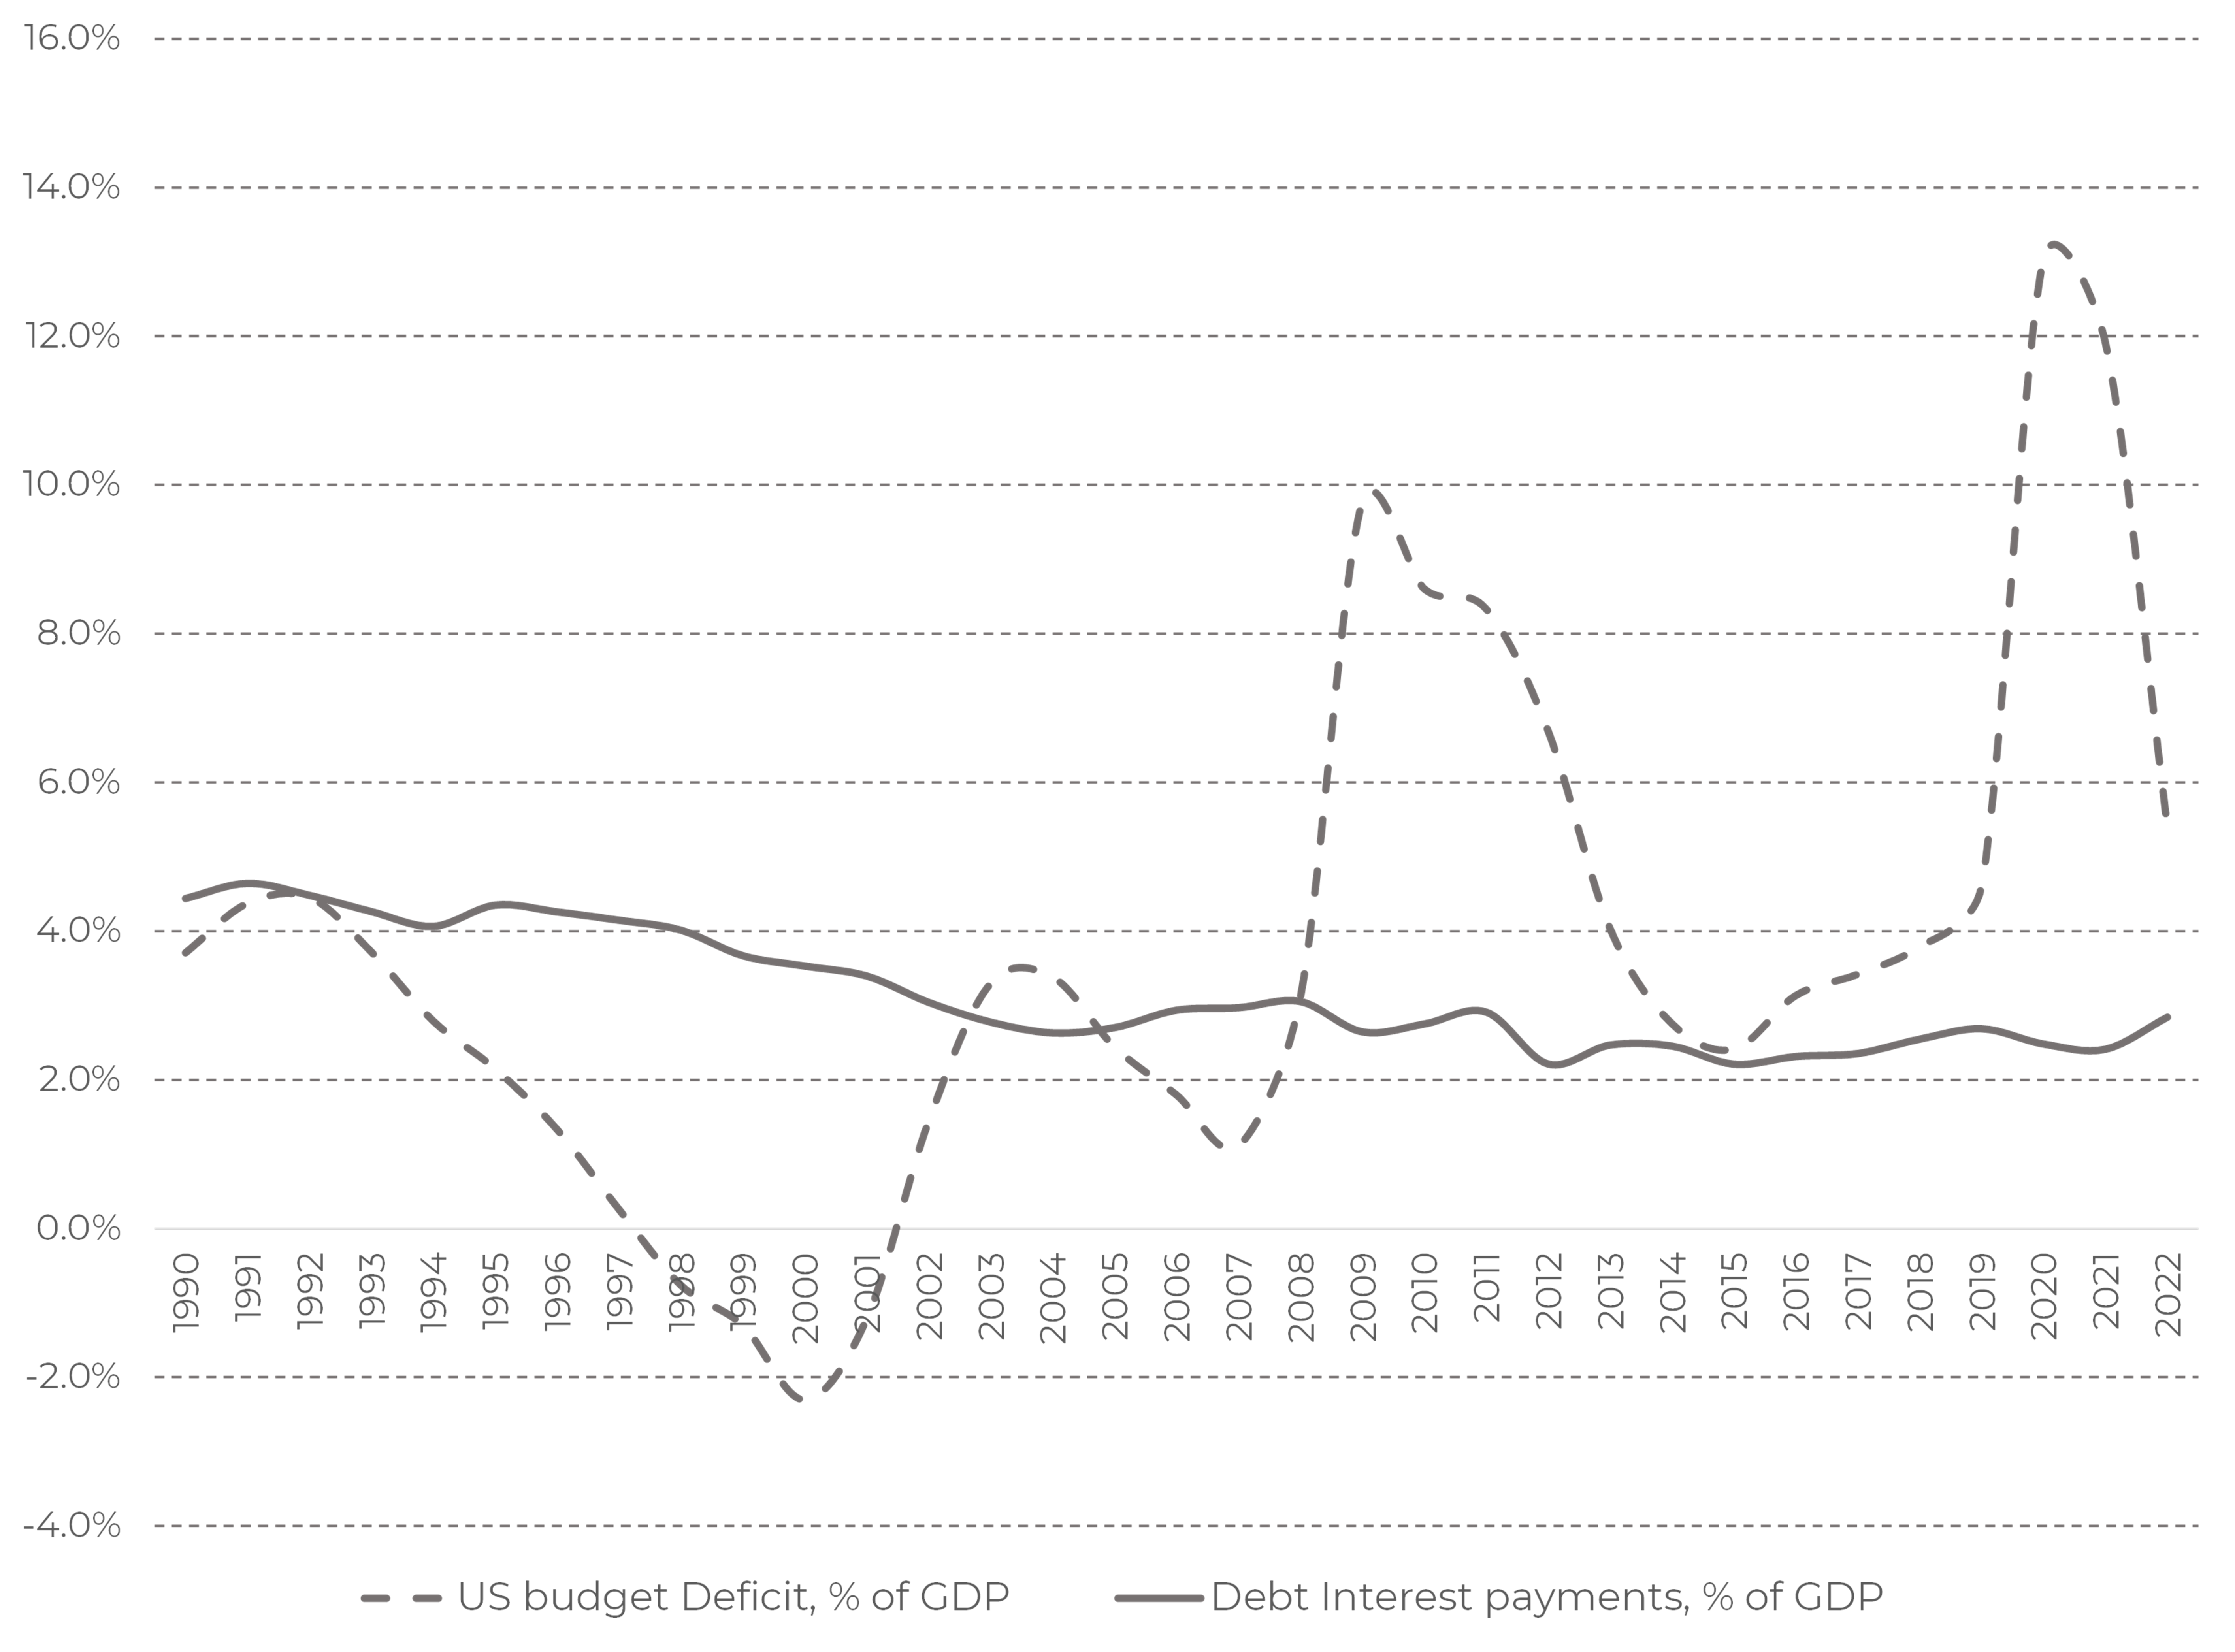
Figure 12 . US budget deficit and Government debt interest spendings, % of GDP
Due to higher rates, the Government interest payments are destined to grow. It does not make sense to overestimate this effect, though. The Treasury Department will redeem old issues with coupon rates of about 3%. The major issues are traditionally going to be at the long end of the US debt curve where the current rate is 3.6%. This 0.6% coupon rate hike will only affect the rollover, not the whole emissions. So, 3% of GDP of interest expenses seems reasonable. At 100%+ debt/GDP ratio the GDP growth of 3% will be sufficient to finance interest payments without the debt/GDP ratio increase. As we have mentioned, 6% of GDP growth is expected in 2023.
Another interesting observation followed from Figure 12 is that the interest payments burden has only been decreasing for years. The long-term downtrend in interest rates (Figure 8) overweighs the uptrend in the debt/GDP ratio.
What if?..
Even though the debt position of the US looks stable, the debt ceiling increase is not an automatic procedure. Hence, there is the risk of default. This risk is higher if, for any reason, politicians whom the debt limit decision depends on, are interested in the US default.
However, it is very hard to find any beneficiaries of such a decision.
Let us imagine, for theoretical purposes, that the US has defaulted on its debt and announced the 50% cut on all principal and interest payments. Such a cut would drag the US debt burden to a 65% of GDP level which looks excellent, so more serious cut is not likely to happen.
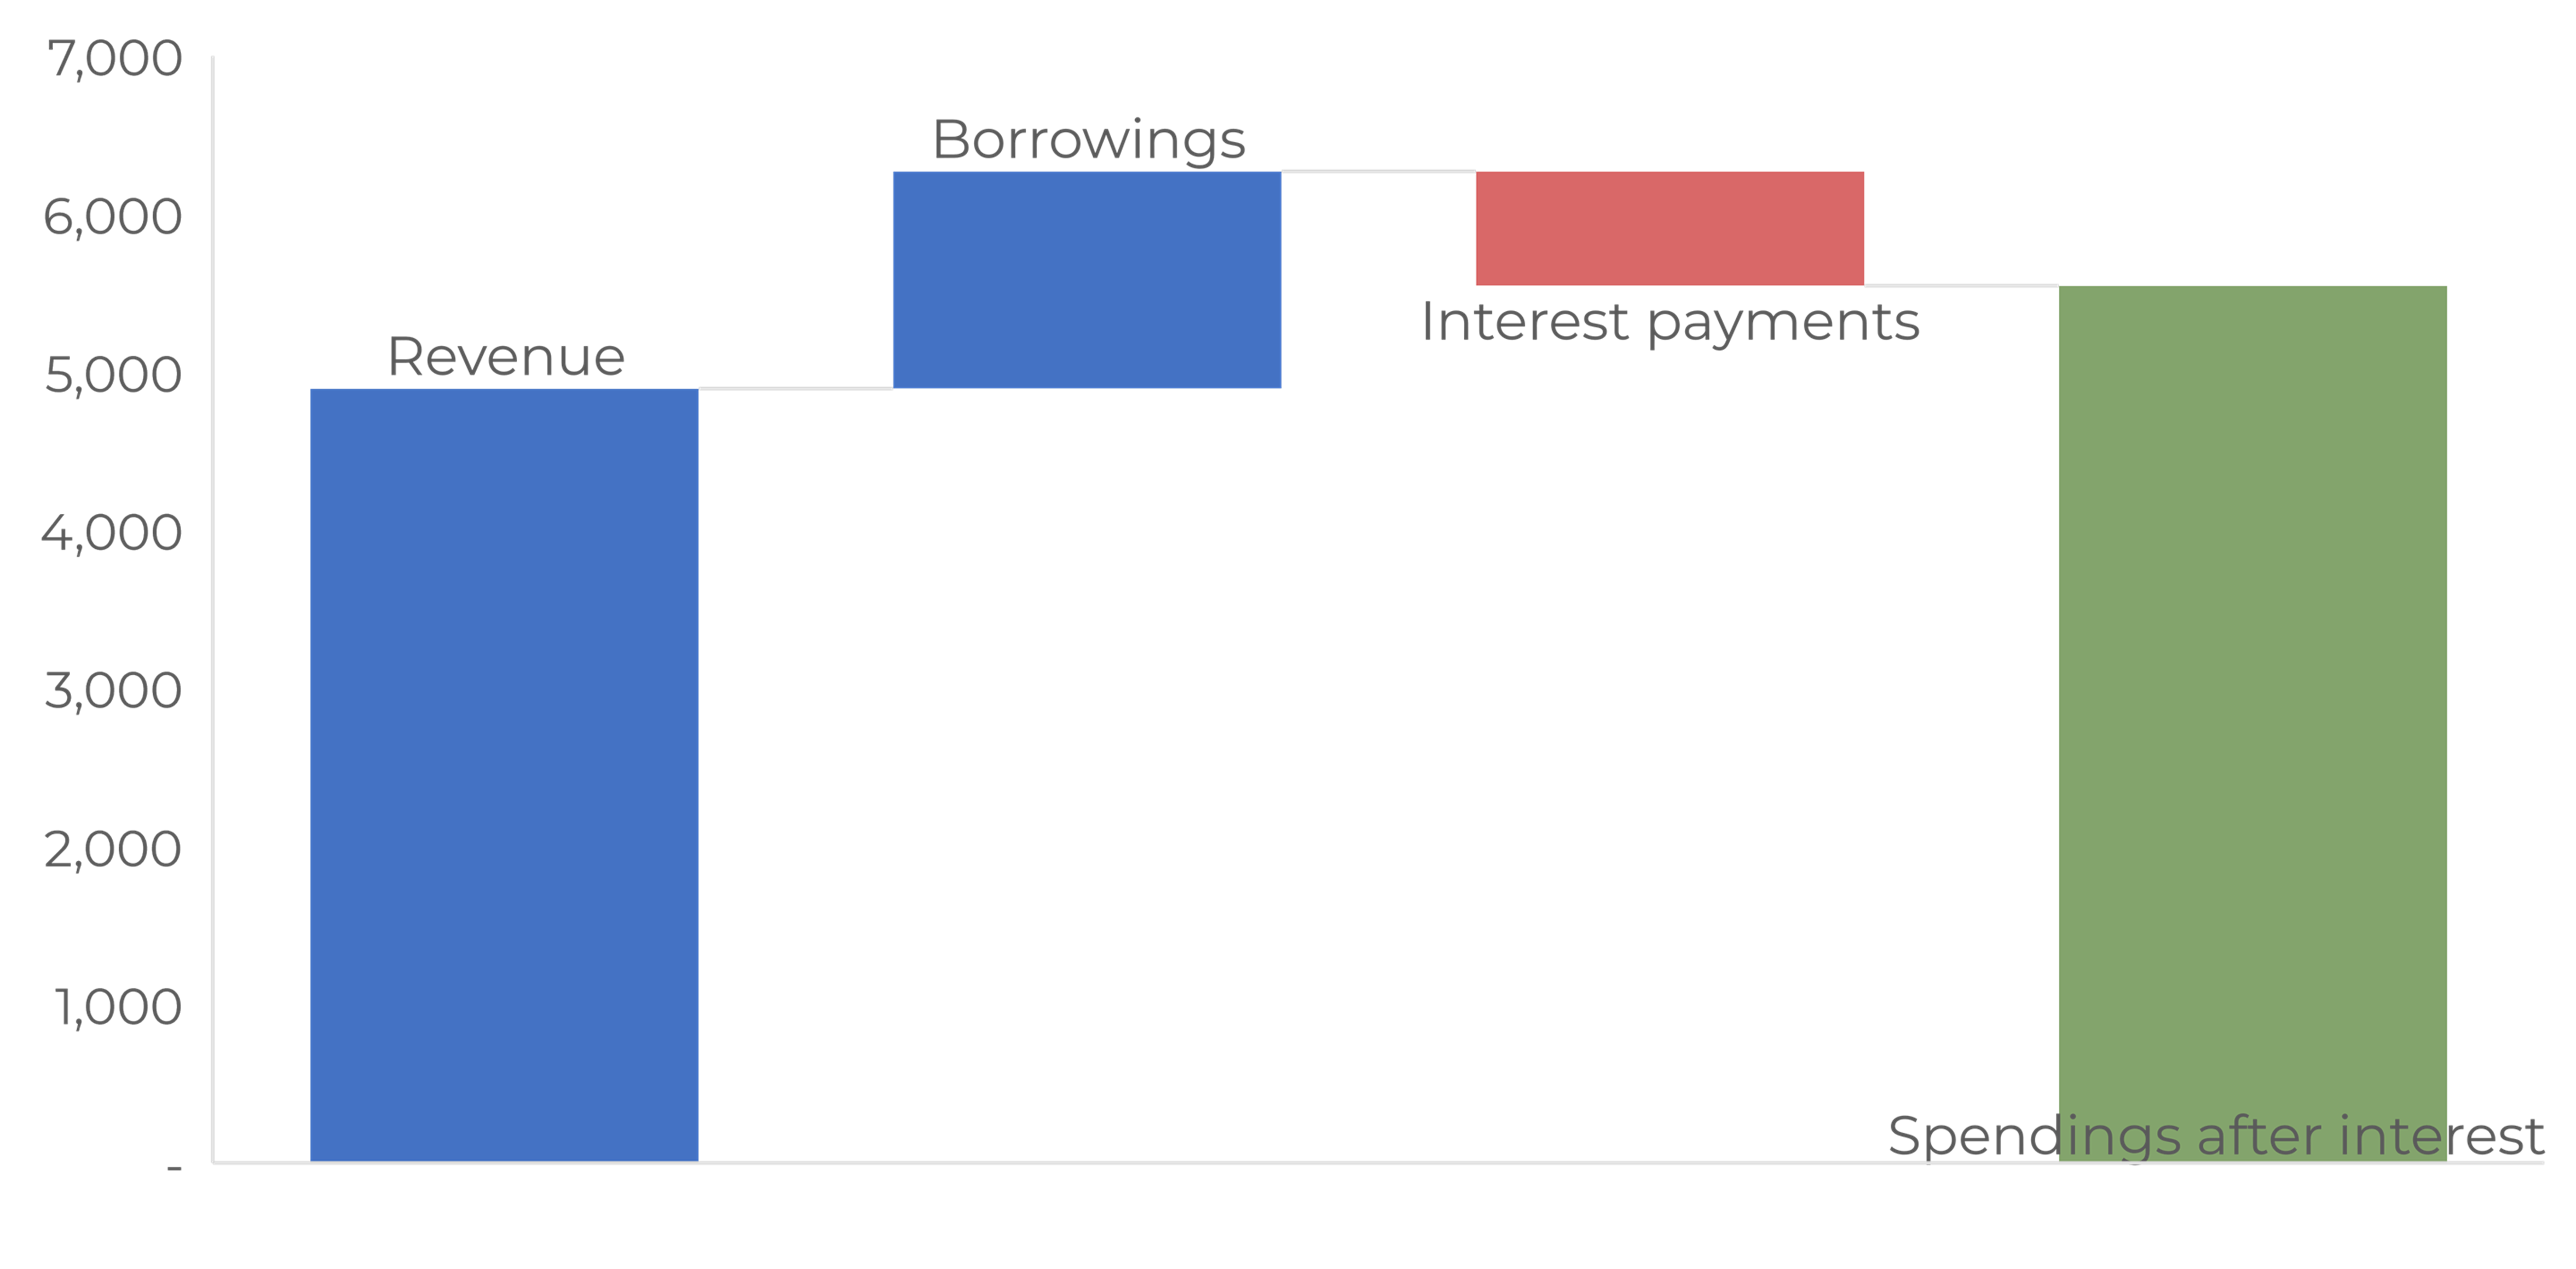
Figure 13 . 2022 US budget balance.
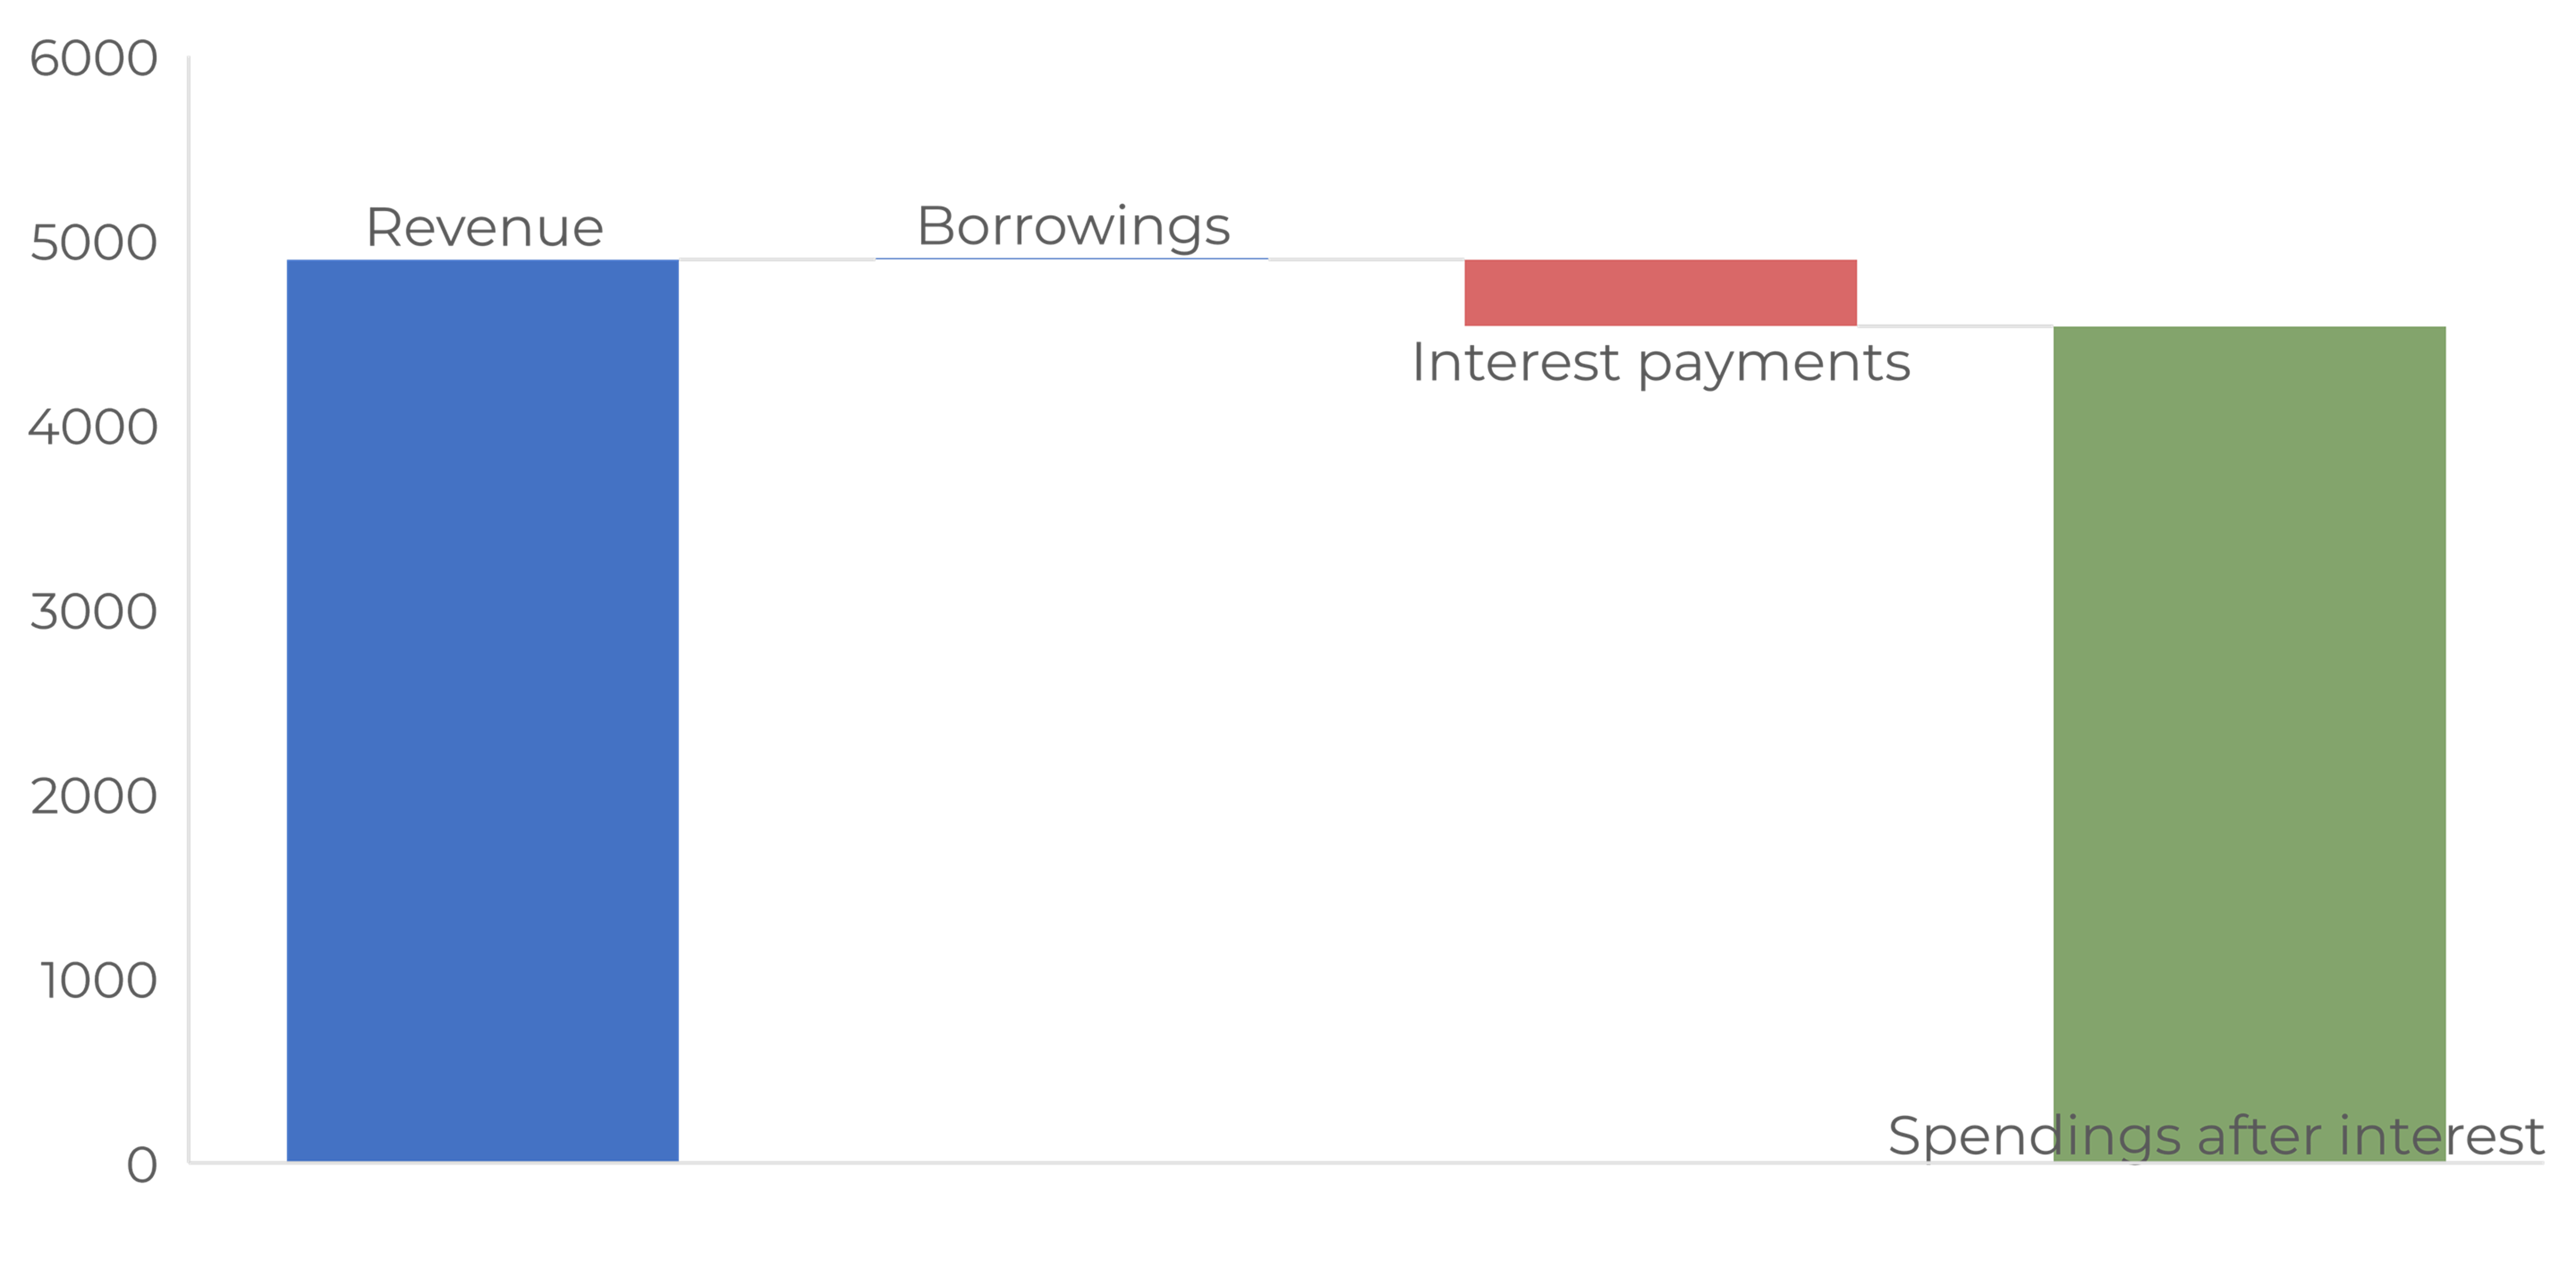
Figure 14 . Modeled 2022 US budget balance with zero borrowing capacity and 50% interest payments cut.
It is imperative that defaults lead to the loss of borrowing capacity. Figure 13 and Figure 14 display how would have 2022 US budget balance changed had the US announced the default in 2022. The direct budget loss makes up 1 trillion dollars, roughly 20% of total spendings. This is the first controversial outcome: the US Treasury will not benefit from an alleged default, despite the interest payments cut. The situation will likely be even more serious because of the principal payments.
The biggest loser will be the Fed holding the largest position of the US bonds.
The 4.3 trillion dollars position of mutual funds, pension funds and insurance companies will hit the savings of individuals.
4.3 trillion dollars4 US banks holdings in Treasury in Agency securities will also be hit. With the total capital of the US banking system standing at 2.2 trillion dollars level5 this will mean loss of entire capital.
It is not with building up this chain of events further: freeze of international dollar transactions, massive corporate defaults, losses in international reserves, banks closures, massive monetary emission, surge of inflation, smashing the status of a reserve currency for the US dollar etc. The cost of default is so obvious that this fact is the best protection from taking such a decision.
It is not impossible, though, that the negotiations on the debt ceiling will be led to a critical point with constantly raising bets from both negotiation parties. This is the way a similar case in 2011 was taking place.
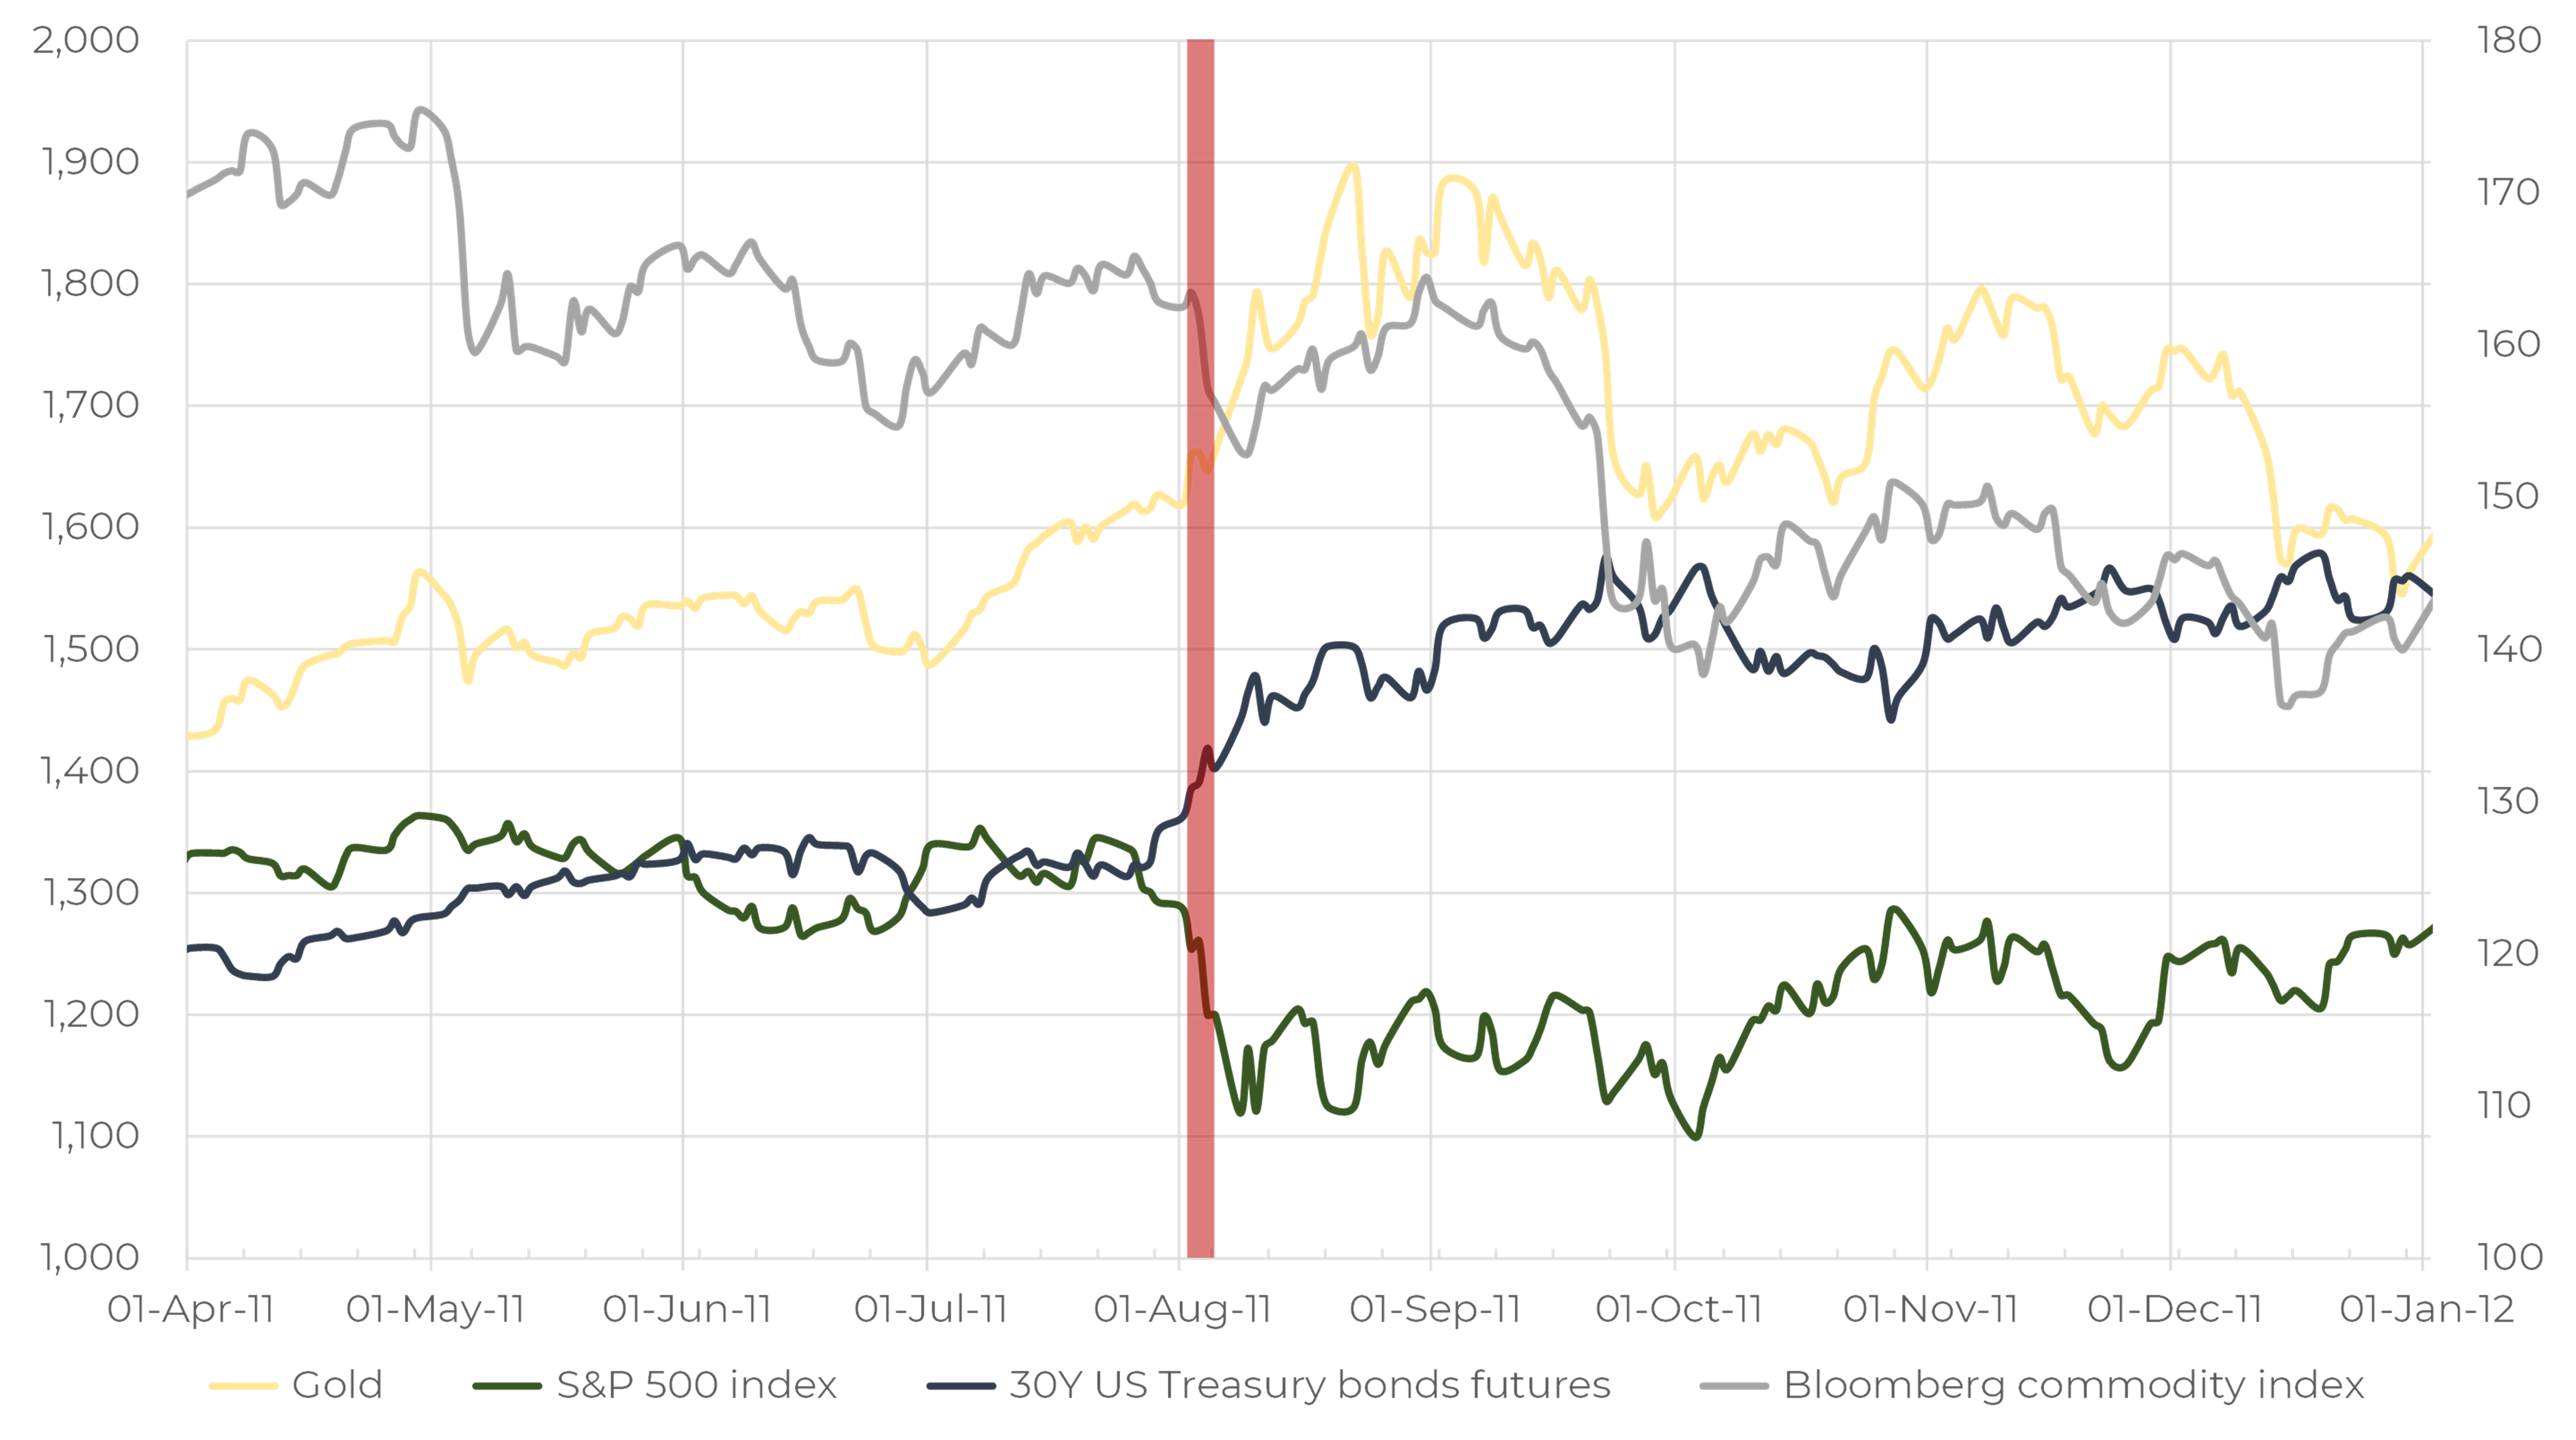
Figure 15 . Various assets behavior in 2011 debt ceiling crisis.
Figure 15 shows that the most protective assets were gold and, it might be strange, but US Treasury bonds.
It is interesting to note that the bond market started surging before the debt ceiling issue was resolved on August 2, 2011. Gold was moving the same way. Stocks and commodities fell sharply.
The 2011 case demonstrated that instability of any sort leads to massive reallocation to the most defensive assets. That happens even in case that this asset is in an epicenter of troubles. Even German CDS expanded from 40bp to 120bp from July to September 2011.
Another observation is that the gold price hike was speculative and short-lived. Gold was quite stable on the back of the European crisis of 2012, however, from a large-scale view it was close to the highest price level ever.
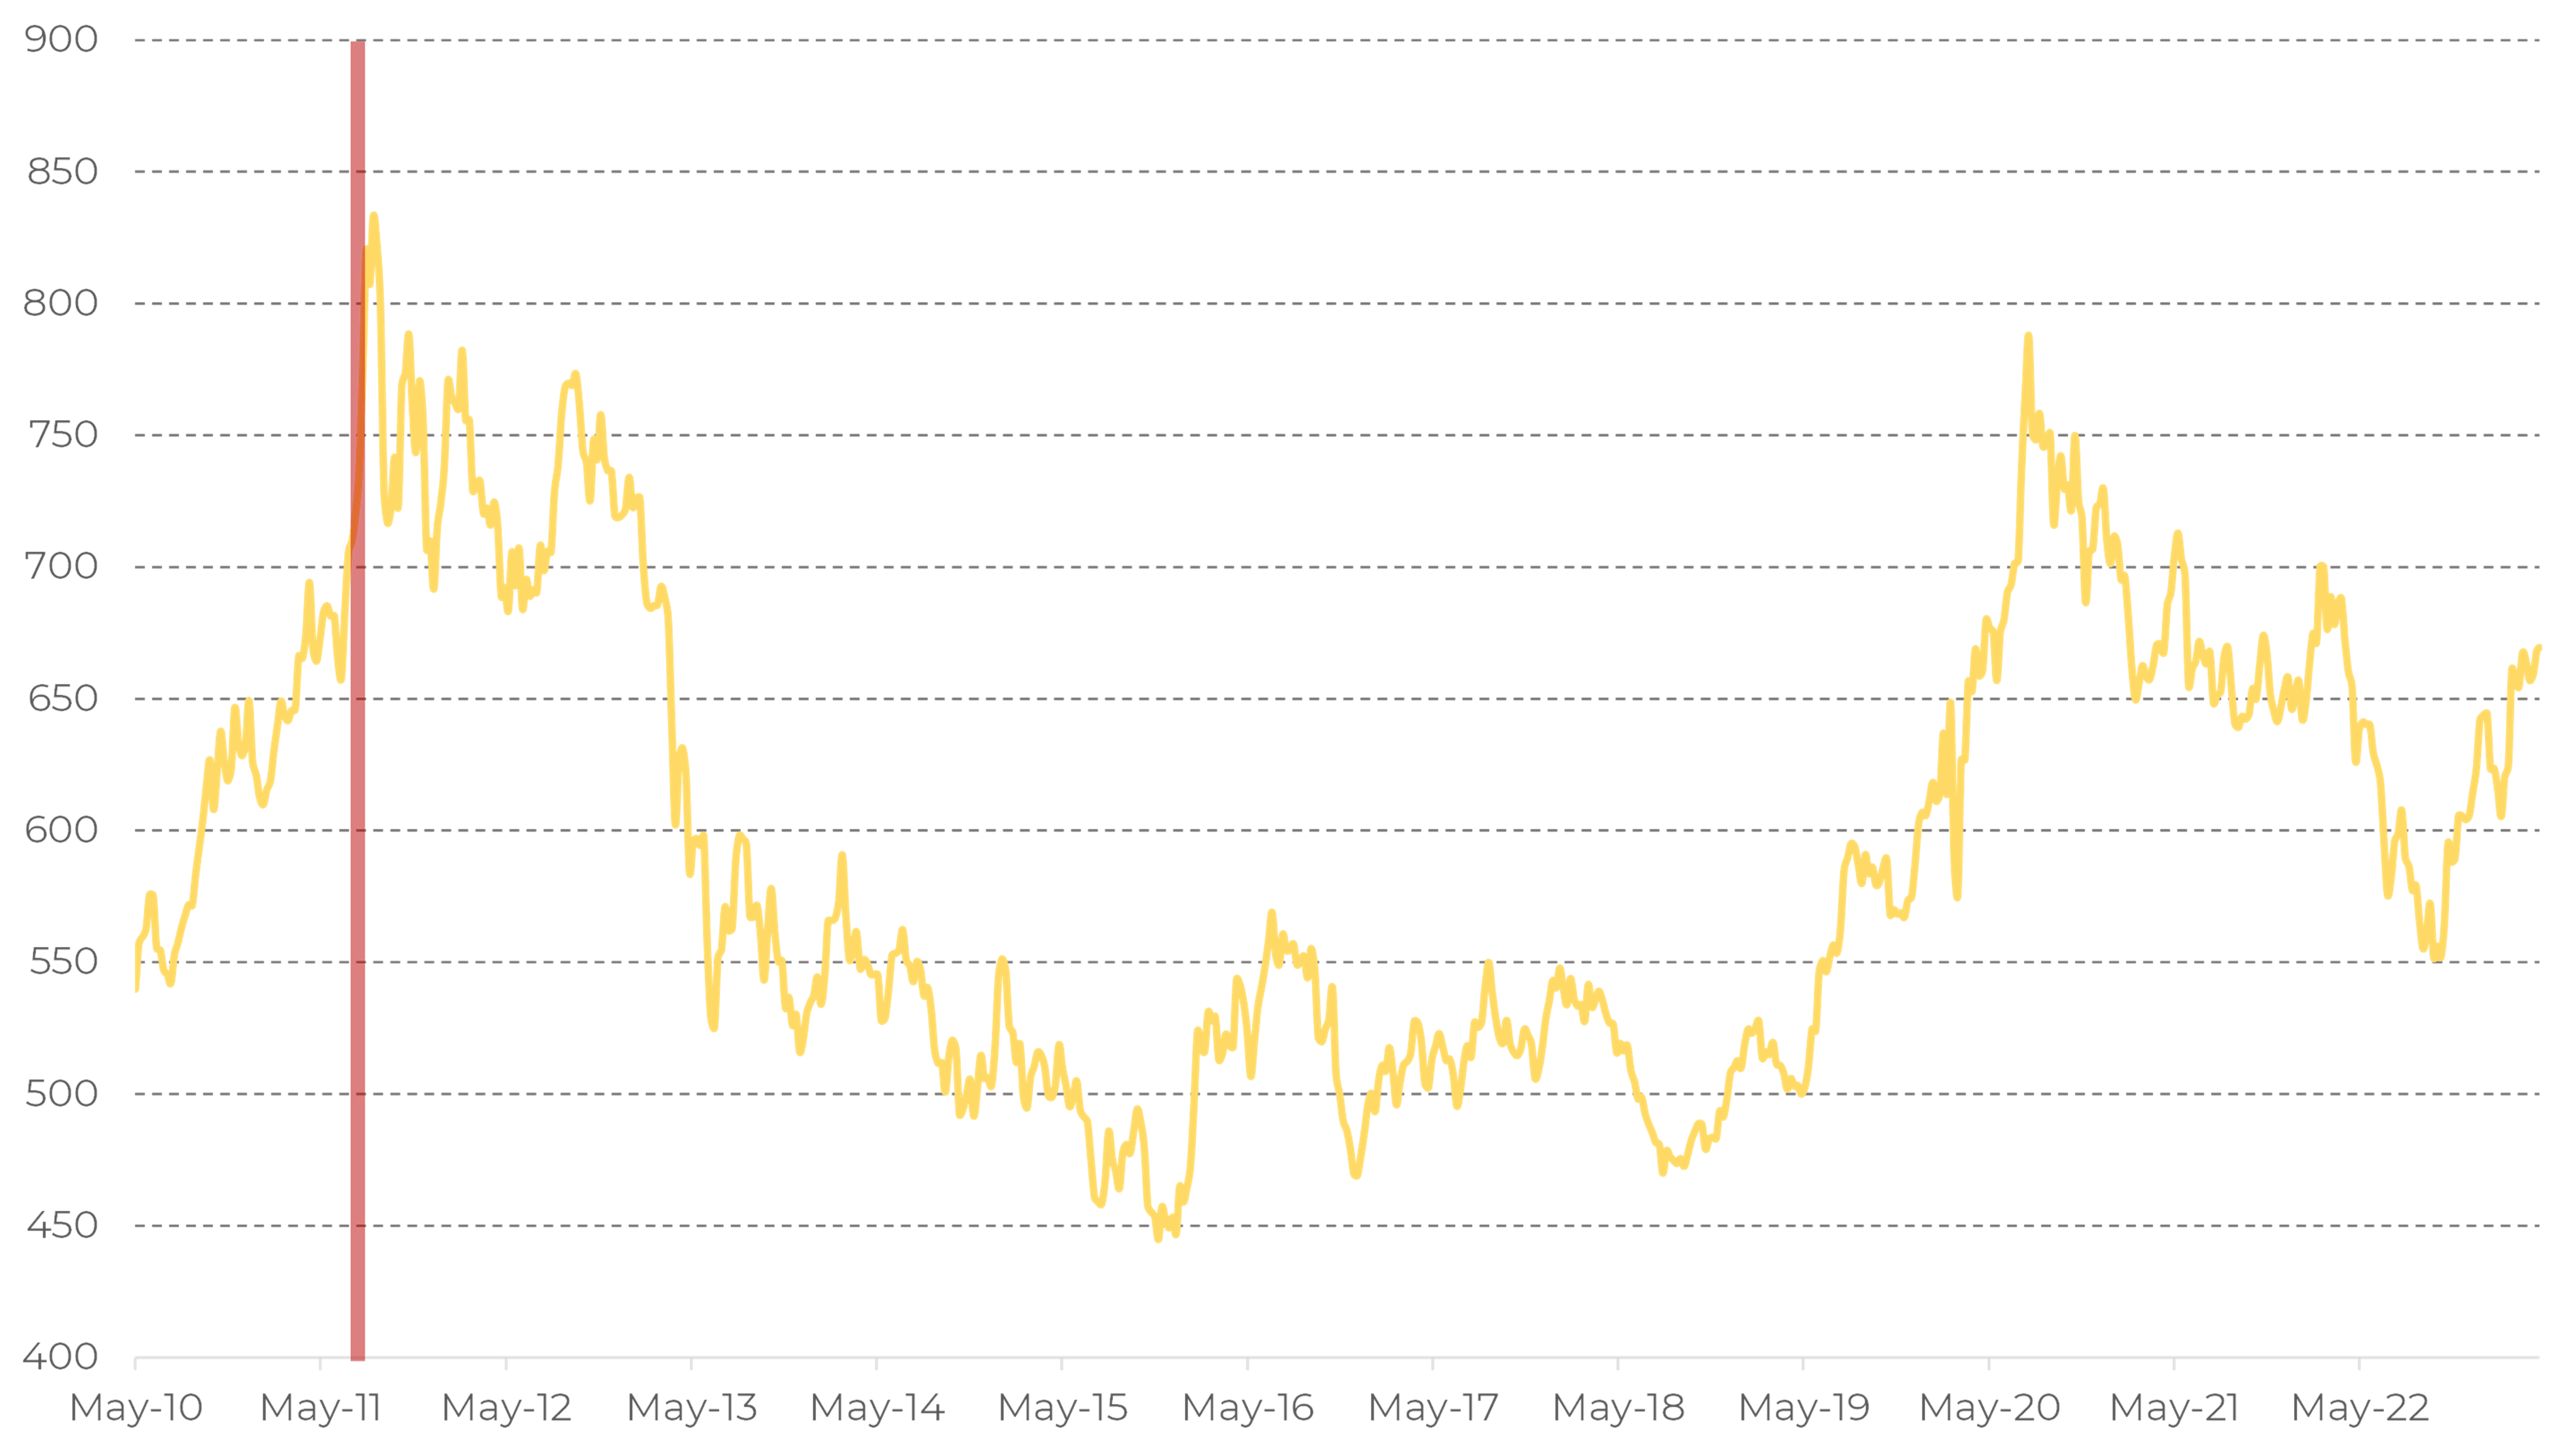
Figure 16. Gold price, inflation adjusted. Red zone – debt ceiling crisis and the S&P rating downgrade.
Now gold is almost at the same level as it was in 2011, if we are taking an inflation adjusted gauge. It has an upside room of about 15-20%. It should be remembered, though, that the gold price historically correlates to inflation, so falling inflation can be a bad backdrop for investments in gold. Without a doubt, US Treasury bonds look disproportionally undervalued compared to gold.
Of course, if a real default happens, gold might be stronger than US bonds. But even in this case this is a big question what direction investors’ money will flow in. The annual gold production stands at 100 million troy ounces, which makes up 200 billion dollars. This is 0.6% of the total US bond market volume. In case of a real threat of default huge amounts of money will run from banks and the equity market. The US Treasury bonds market is the only place capable of digesting such a huge inflow. And still one of the safest places on earth.
Summary
The debt ceiling issue produces extra risks for markets. The nature of this risk now is completely in the political sphere. From an economic perspective the credit quality of the US remains high (perhaps, the highest in the world). The country is very far from a point where debt servicing becomes an issue. Announcing a default would lead to disastrous consequences for the US, so we believe that the US top officials are aware of that, and they are poised to resolve the issue.
The pattern of 2011 shows that even under threat of default the US bonds are in a beneficial position as this triggers massive capital reallocation into the most defensive market segments.
1 . https://www.cnbc.com/2023/05/08/debt-ceiling-janet-yellen-says-default-would-be-economic-catastrophe.html
2 . https://www.worldgovernmentsummit.org/docs/default-source/publication/2023/global-economic-diversification-index-2023_full-report_web25d1d0c3-dfc6-4a3d-8941-5643a0ca18ab.pdf?sfvrsn=85aef27d_3
3 . https://www.federalreserve.gov/newsevents/pressreleases/monetary20220504b.htm
4 . https://fred.stlouisfed.org/series/USGSEC
5 . https://fred.stlouisfed.org/series/QBPBSTLKTEQKTBKEQK