Following a substantial market rally in January, fears of inflation have resurfaced. Several important macroeconomic indicators that were released in February and March have indicated stronger-than-expected inflation pressures and a hotter-than-expected labor market, leading investors to anticipate more aggressive actions from the Fed. As a result, both bonds and equities were sent down ahead of the March FOMC meeting. However, this review suggests that the combination of macroeconomic data is seasonal and temporary, and that the market correction presents an opportunity to take on risk.
The US Treasury bonds current pattern.
Figure 1 compares 3-month US Treasury bonds yield and inflation:
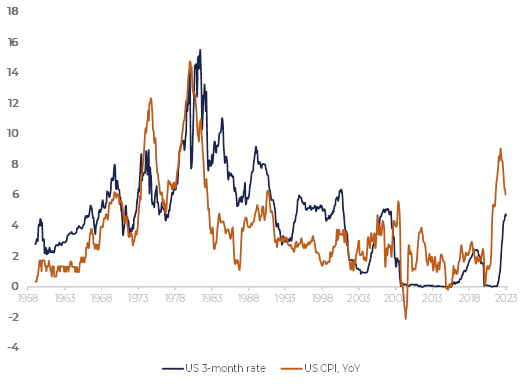
Figure 1
Before 2000 it had been normal that the short-term rates were higher that the inflation rate. Since 2000 we have been living in a period of below inflation rates. When Fed Chairman Volker was fighting inflation in early 80-s he increased the key rate higher than CPI. Now the key rate is close to its Fed target level, but it is still much lower than CPI.
It looks like that the US economy no longer digest high rates. Indeed, the Figure 2, comparing the real short-term rates and the GDP growth rate, only fast-growing economy can tolerate high rates:
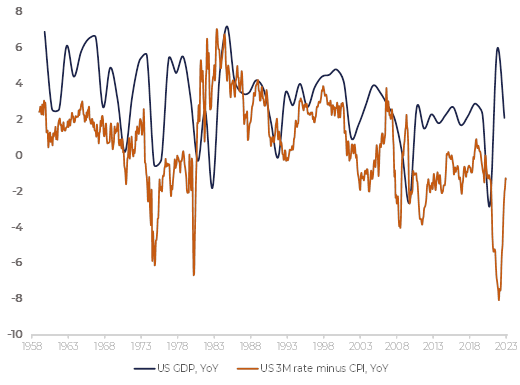
Figure 2
Inflation is also going down. Several rounds of QE both in the US and EU could not push prices up. We are living in a stage of japanization of the global economy with the GDP growth rate, inflation and interest rates gradually decreasing. Of course, in the mid-term inflation can grow substantially. There are two reasons for that, except high economy growth rate: surge in commodity prices and the monetary excess. Commodities happened to be the main inflation driver in 1970-s, with the total growth of Bloomberg commodity index at 350% within 1969—1980 period. Now this index is only 12% higher than before the pandemic. The major inflation driver now is a monetary excess. The M2/GDP ratio grew 34% in 2018—2020. The M2/GDP ratio has been decreasing since June 2020, though, being only 15% higher than before pandemic. The monetary pressure is easing on its own with rising prices pushing the nominal GDP higher.
So, there is no ground for the long-term inflation and, hence, high rates.
The next observation we would like to highlight is that the long-term rates “live their own lives”, correlation to the short-term rates, but not completely following them. Figure 3 compares 3-month US Treasury bond yields and the 10-year yields:
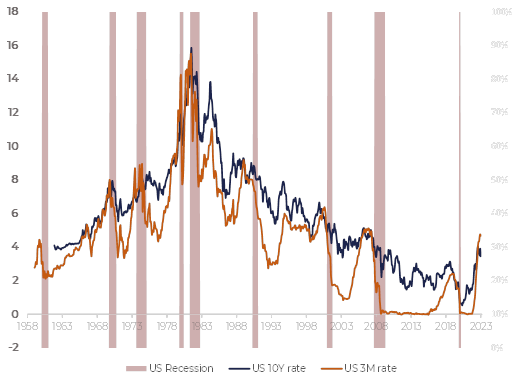
Figure 3
It can be said that the 10-year UST rates have been in a long-term downtrend reflecting the transition of the economy from a high-growth state to a low-growth one accompanied with the low inflation.
One can hardly argue that this logic no longer works. Then the question arises: why the long-term rates grew so impressively in 2022?
The positive correlation between short-term and long-term rates nevertheless exists. However, it is not sufficient for explaining so impressive 2022 long-term rates surge.
We assume, there are two more reasons for that.
The first reason is the Fed’s balance sheet.
Figure 4 represents the Fed’s balance sheet as a % of the US GDP. Its contraction is caused by the sale of US government bonds by the Fed: it is one of the measures helping to keep the liquidity excess under control. For the UST market it means that a large bond seller comes into play. The Fed supported the bond market by several rounds of QE, and now the game reverses.
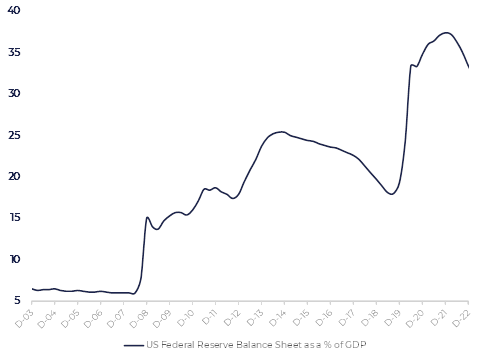
Figure 4
The second reason is the wave of currencies devaluation. The Japanese Yen (Figure 5) is the brightest example:
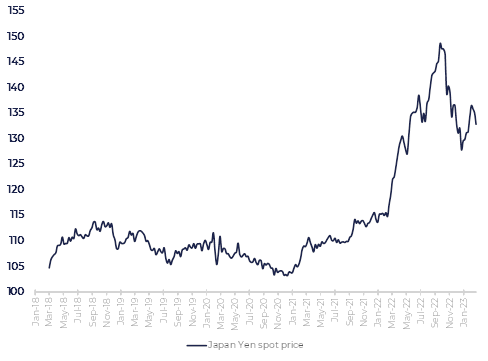
Figure 5
Almost 50% devaluation forced the Japan Central Bank to support the national currency by the sale of its FX reserves, which means the sale of US Treasuries: the US CB is one of the largest holders with near $1tn holding value.
The Chinese Central bank also sold part of its stake.
These two factors completely changed the landscape of the UST market: those who have been supporting bids for years, now started selling. This, in turn, made all other players reluctant to buy. The sellers’ pressure reached its peak in the 2022 H2 with UST yields rocketing to rarely seen levels.
We would add the third, less evident factor.
CPI became a major driver for both stock and bond markets. Any sign of rising inflation or any hawkish Fed Chair commentary resulted in weakness in all markets around the globe. This, in turn, is bringing about the positive correlation between bonds and shares which is not a typical pattern:
Figure 6 compares the 30Y US Treasury price futures and S&P index with their correlation displaying at the bottom of the chart:
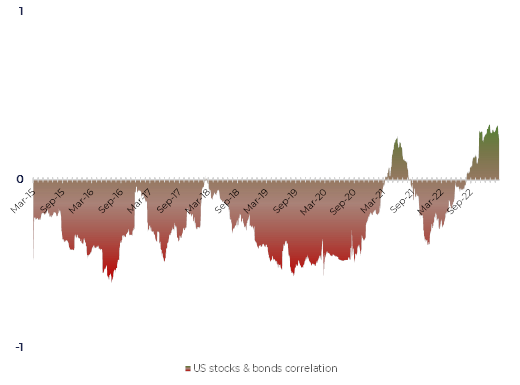
Figure 6
The positive correlation of the markets is changing investors’ perception. Now corrections in the stock market result in decrease of UST prices. It is fundamentally fair in case the inflation is a main driver. However, when equities are driven by the recession fears it cannot be justified.
Meanwhile, the recession fears are starting to dominate over inflation fears. It was the first time on the 6 th of January that the unemployment rate came out much below estimates but did not affect the market negatively. Before that low unemployment was associated to the inflation risks and pushed bonds and equities down immediately. That day, however, happened to be the first day of the January rally. Data followed over the nest several trading sessions only confirmed that the labor market remained hot. On the 17 th and 18 th January Empire Manufacturing and Retail Sales were published. They pointed to the slowing in the economy and sent the market lower. Such figures, had they come out several months ago, would not have driven investors so pessimistic as it would have meant that the Fed could not go too far in the rates increases.
Recession is a positive factor for the UST market. Recessionary periods are always accompanied by deflation. So, the whole picture looks like this: the US Government bonds are undervalued, while possible recession only accelerates the rebound.
It does not mean, though, that buying US bonds is a zero-risk idea.
The first risk is that the Fed can go further with the rate hikes. Fundamentally the relation between long-term and short-term rates is weak. The investors’ perception can be different, though: everyone can see how deeply the long-term bonds fell on the back of rising key rate.
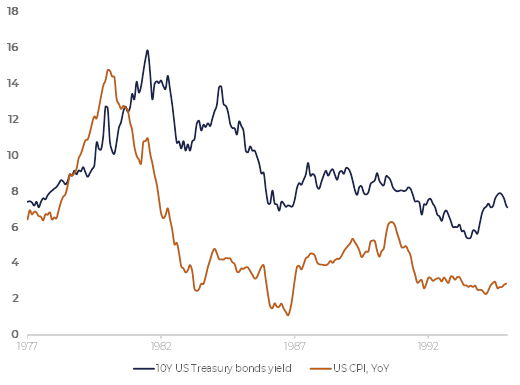
Figure 7
Another risk is that the rates decrease dynamics can be quite muted. In 1980—1985 the Fed Chair Volker was decreasing the key rate very slowly, even after CPI had dropped significantly. 10Y UST rates were at 14% level in 1984—at the same level as in 1981—1982 period, despite the CPI dropped from 14% to 4% over that period (Figure 7).
So, the danger is that the UST market will get used to such a rates level, and the bond prices recovery will be very slow then.
At last, Fed will continue selling bonds which does not create a brilliant opportunity situation.
In whole, UST look undervalued with no significant downward drivers existing, but the upward drivers are also not on the table now. In this situation the flat range seems to be the basic scenario for the UST market. It would make sense to enhance the position in UST when it seems reasonable from a technical analysis perspective, not waiting for significant price corrections.
Figure 8 displays the 30Y US Treasury bonds futures:
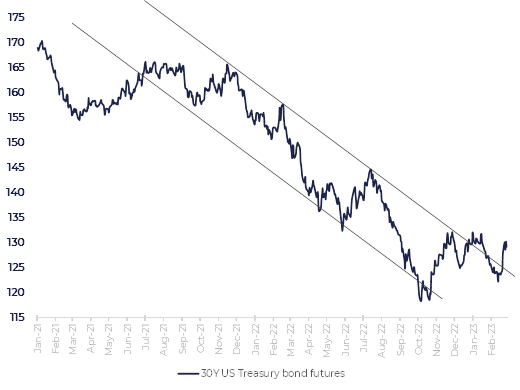
Figure 8
The downward trend is broken, now we see the return to the downtrend resistance. The next levels to buy bonds are 125 and then, 120.
Now, let us get back to the fundamental factors. The Fed’s quantitative tightening is the simplest one: it is predictable, it will go on, it will hardly be enough to send the bonds down, but it will definitely contain the rebound.
As to a possible key rate hike, it is not clear what influence it will cause. The core logic tells us that the long-term bonds are under pressure when a key rate is going up. In current situation, however, any substantial key rate increase will trigger recession expectations. Recession, though, is the best time for keeping government bonds in portfolios. It is possible that the key rate hike effect will be quite short living, with a strong bonds price recovery coming after that.
We assume that the most pessimistic case for the UST market would look like this:
· The inflation remains under control, there is no unexpected key rate hike.
· The core inflation (i.e., services inflation) appears to be sticky and is going down quite slowly. This encourages the Fed to keep rates high as long as possible.
· The economy remains strong enough to avoid slipping into a recession and digest a long period of high rates.
In other words, this is a soft-landing scenario.
We will, anyway, have some landing: hard or soft. The hard-landing case is very simple: it is bad for stocks and good for bonds.
So, the share of US Treasury bonds in a portfolio depends on what we think about the soft landing: how probable it will be and what trajectory the economy will take.
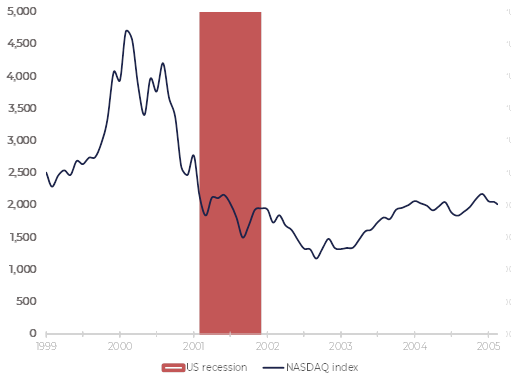
Figure 9
The NASDAQ index chart (Figure 9) shows that the stock market can stagnate for years even after a recession ends (the red period on the chart is the 2001 US recession). Even if a recession does not happen, the long period of high rates will contain the equity market growth just the same way it does with the bond market.
For now, there is no way to determine what market will exit the stagnation period first and how substantial this upward movement can be. We can assume that the best performance the stock market can show corresponds to one that happened with NASDAQ index in 2003—2005. Then it was around 50%.
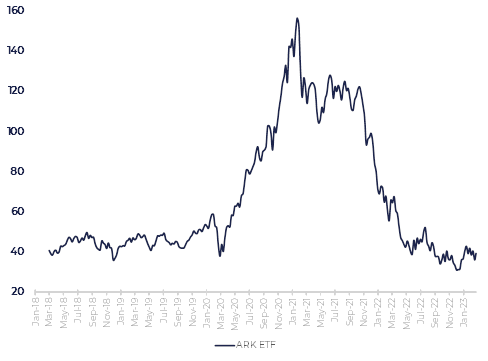
Figure 10
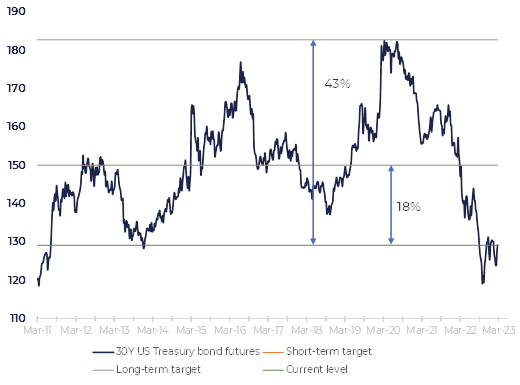
Figure 11
The ARK ETF (Figure 10) which can be, to some extent, compared to NASDAQ in 2000s, can reach 60 from a technical perspective. It also gives 50%.
S&P 500 growth in 2003 was less impressive: around 30%. Such an upside seems too big for now as it sends the S&P 500 index much above the December 2021 high. So, this is an optimistic estimation of the potential upside now: 50% in the tech stocks segment and 15%—20% in S&P 500 universe.
For estimating the US Treasury bonds potential upside we take the 30Y UST futures (Figure 11).
Getting back to its mid-range of 2015—2021 period implies a 18% upside, while returning to its high, caused by the pandemic fears, points to a 43% upside.
As we can see, the upside potentials of the stock and UST markets are comparable. Bonds should behave much better in case of the hard landing, while the soft-landing gives roughly equal chances to both markets.
January inflation spike: one-off or the evidence that the Fed has lost its fight?
The hot labor market is considered as one of the major drivers of high inflation. The primary logic tells us that the scarcity of the labor force is caused by the monetary excess in the economy. Figure 12 compares US Job openings and M2/GDP ratio.
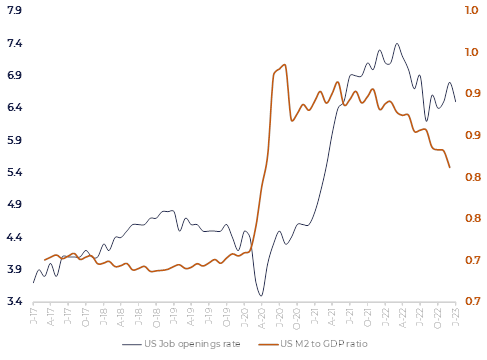
Figure 12
The monetary excess is gradually declining with the vacancies rate declining also until autumn 2022. Then new jobs stabilized and, moreover, unexpectedly surged in December 2022. This leads us to a question whether the Fed can manage inflation. The fear that the 5% key rate is not enough to push prices down reemerged. This figure was published in the beginning of February – that was the local S&P 500 high.
Open job vacancies were transformed into an impressive figure of January signed job contracts (US employees on nonfarm payrolls, Figure 13):
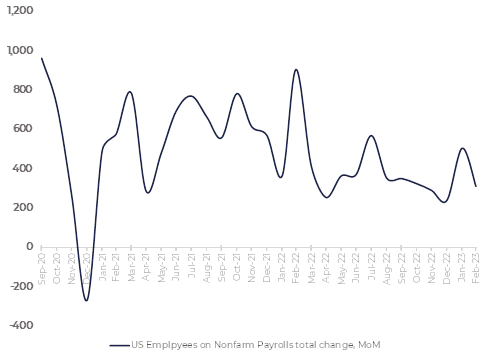
Figure 13
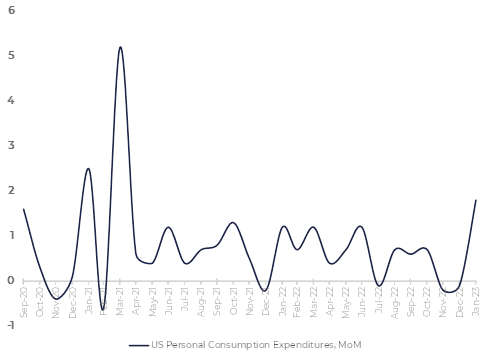
Figure 14
US Personal consumption also jumped in January witnessing high inflation pressure (Figure 14).
At last, January Consumer Price index (YoY change) came in at 6.4% level, 0.2% higher than expected.
This bunch of economic data creates an impression of a new inflation spiral. Comments from the Fed’s officials that more aggressive tightening needs to be done followed.
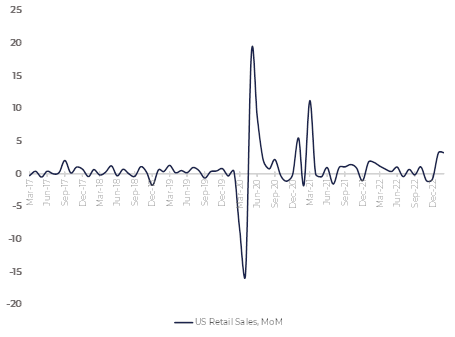
Figure 15
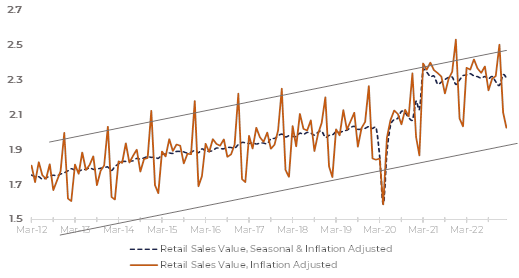
Figure 16
However, there are reasons to believe that hot labor and inflation readings is a seasonal phenomenon.
First, we note that the retail sales reading (YoY change, seasonally adjusted, Figure 15) gives the same pattern as the personal consumption and payrolls do.
Figure 16 let us look at the same figure, but in the index representation. Both indexes on the chart are inflation adjusted. The non-adjusted retail sales are fluctuating within an uptrend with the growth rate of 2% due to the economy expansion. This gauge is cyclical with the hot Christmas season in December when the retail sector operates at almost full capacity.
Starting 2021 the average retail sales are consistently above the mid-range mirroring the excess of money in consumers’ wallets. It is reasonable to assume that the Christmas sales should also be proportionally hotter than usual. However, the seasonal adjusted figure came lower both in 2022 and 2021. It is likely that the retail sector simply cannot operate at a capacity higher the upper limit of the range, it gets overloaded there. So, the December sales turn out to be less impressive than usual. It happens not because of the lack of demand but because of the supply limitations. It causes, though, deferred demand which popped up in January when the retail sales dropped much less than it did earlier. On the back of excess demand businesses opened new vacancies and hired people then, in January. On top of that, the supply constraints caused an inflation spike.
It is worth mentioning that this pattern already happened a year ago, in January 2022. It is not that investors did not see it as the retail sales uptick expectations stood at a 2% level. What frightened investors is that the 2023 figure came in above expectations. The question arises: why, despite cooling down inflation and high rates we observed stronger retail dynamics than a year ago?
US Bureau of Labor Statistics shows that the main labor market component driving the vacancies up is leisure, mainly hotels and restaurants. By the way, hotels’ earnings (Hyatt, Marriott, etc.) showed record levels in Q4 2022, highlighting the same picture from another point of view. A year ago, COVID restrictions imposed because of the spate of Omicron strain cooled down the demand. Now, all COVID measures are lifted, so the capacity of businesses is becoming the main supply limitation.
There is no reason to assume that in 2023 the labor market and personal consumption is going to make up a pattern different from what we saw in 2022. If so, the stabilization of all these gauges is what it makes sense to expect in 2023.
Concerning inflation, we will likely see strongly negative YoY figures in March due to the high base effect. This means that, given current commodities prices, it makes sense to bet on further CPI declining.
It is true that the Fed gives more weight to the core inflation. However, historical patterns show that the core figures usually follow the headline inflation with a small lag of 3—6 month. Figure 17 displays the comparison of the headline YoY CPI and the core CPI:
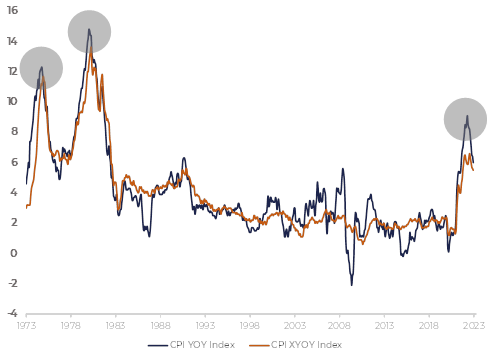
Figure 17
Summary
Both equity and bond markets have undergone corrections recently, largely due to concerns over a potential increase in monetary tightening as a response to rising inflation. However, we believe that these inflationary pressures are primarily driven by seasonal Christmas demand growth and are likely to be short-lived. In fact, we expect YoY inflation gauges to cool down in 2023, due to the high base effect in the commodity market. As a result, we anticipate a decrease in inflation fears and a potential positive momentum for the markets.
While both the bond and equity markets have comparable upside potential, they differ in their behavior during economic downturns. Bonds tend to perform better during a hard landing or recession, while stocks fare better during a soft landing characterized by sticky inflation, a resilient economy, and the absence of shocks. We believe that the US Treasury bonds market carries less downside risk, particularly if inflationary pressures turn out to be temporary, as we expect.
Overall, while potential macroeconomic shocks may cause market disruptions, we do not anticipate a more aggressive Fed policy response to inflation. Instead, any shocks are more likely to be driven by broader macroeconomic factors rather than inflation concerns.