During the recent FOMC press-conference, Chair Powell from the Fed highlighted that the US economy appears more resilient than previously thought. He affirmed that two more rate hikes would be fitting for the present economic environment, an assertion that investors greeted with optimism. However, in our perspective, this optimism may be premature. The robustness of the US economy could prove misleading. Robust consumer demand yields high profits. In turn, these corporate profits underpin the labor market. A heated labor market encourages consumer spending, imparting a sense of stability. This positive feedback loop supports the economy, yet it could also precipitate an abrupt crash.
Background
We'd like to start by offering our perspective on the source of the current market optimism. Insufficient evidence suggests it's anything more than a typical market technical rebound. This rebound emerged late in 2022, when various equity and bond indices were signaling a 20—30% Year-to-Date (YTD) drop. The investors' mood took a particularly gloomy turn after Fed Chair Mr. Powell's Jackson Hole speech. Since then, recession expectations, alongside key rate expectations, have been driving the market.
Though some stocks showed faint signs of a potential rebound, the atmosphere remained largely negative, impacting investors and corporate managers. This resulted in muted Q1 guidance. However, as it turned out, the situation wasn't as dire as previously expected, and Q1 results, while somewhat lower, were not overwhelmingly negative. Neither Q1 nor Q2 experienced a recession. This unexpected turn of events fueled the market rebound in H1. Moreover, the AI rush swung investors' mood towards euphoria.
Fundamental figures have also stayed strong, reinforcing an illusion of stability. Investment bankers have reported seeing 'green shoots' on Wall Street. Simultaneously, the factors contributing to economic weakness and potential recession remain. Although we haven't seen signs of it yet, does that mean the risks of a slowdown have been significantly reduced? We posit they have not and, in fact, are still growing.
Retails Sales and the Labor Market
Let's commence our discussion with Figure 1, which displays core Personal Consumption Expenditure inflation – the core gauge used by the Fed. It reached 0.4% in March 2021, and since then, it has fluctuated around that level, with only minor signs of abating. With the rate of PCE decrease remaining constant, the fight against inflation will be a long-term battle.
Nonetheless, the excess of money in the US economy – the primary catalyst for inflation – is rapidly contracting (Figure 2). The monetary mass has now reached a point where it would have been, had the pandemic not occurred. A more conservative estimate, assuming that the balanced M2-to-GDP ratio should be at pre-COVID levels (70%), suggests that a further 10% contraction of the monetary mass is necessary to balance the system.
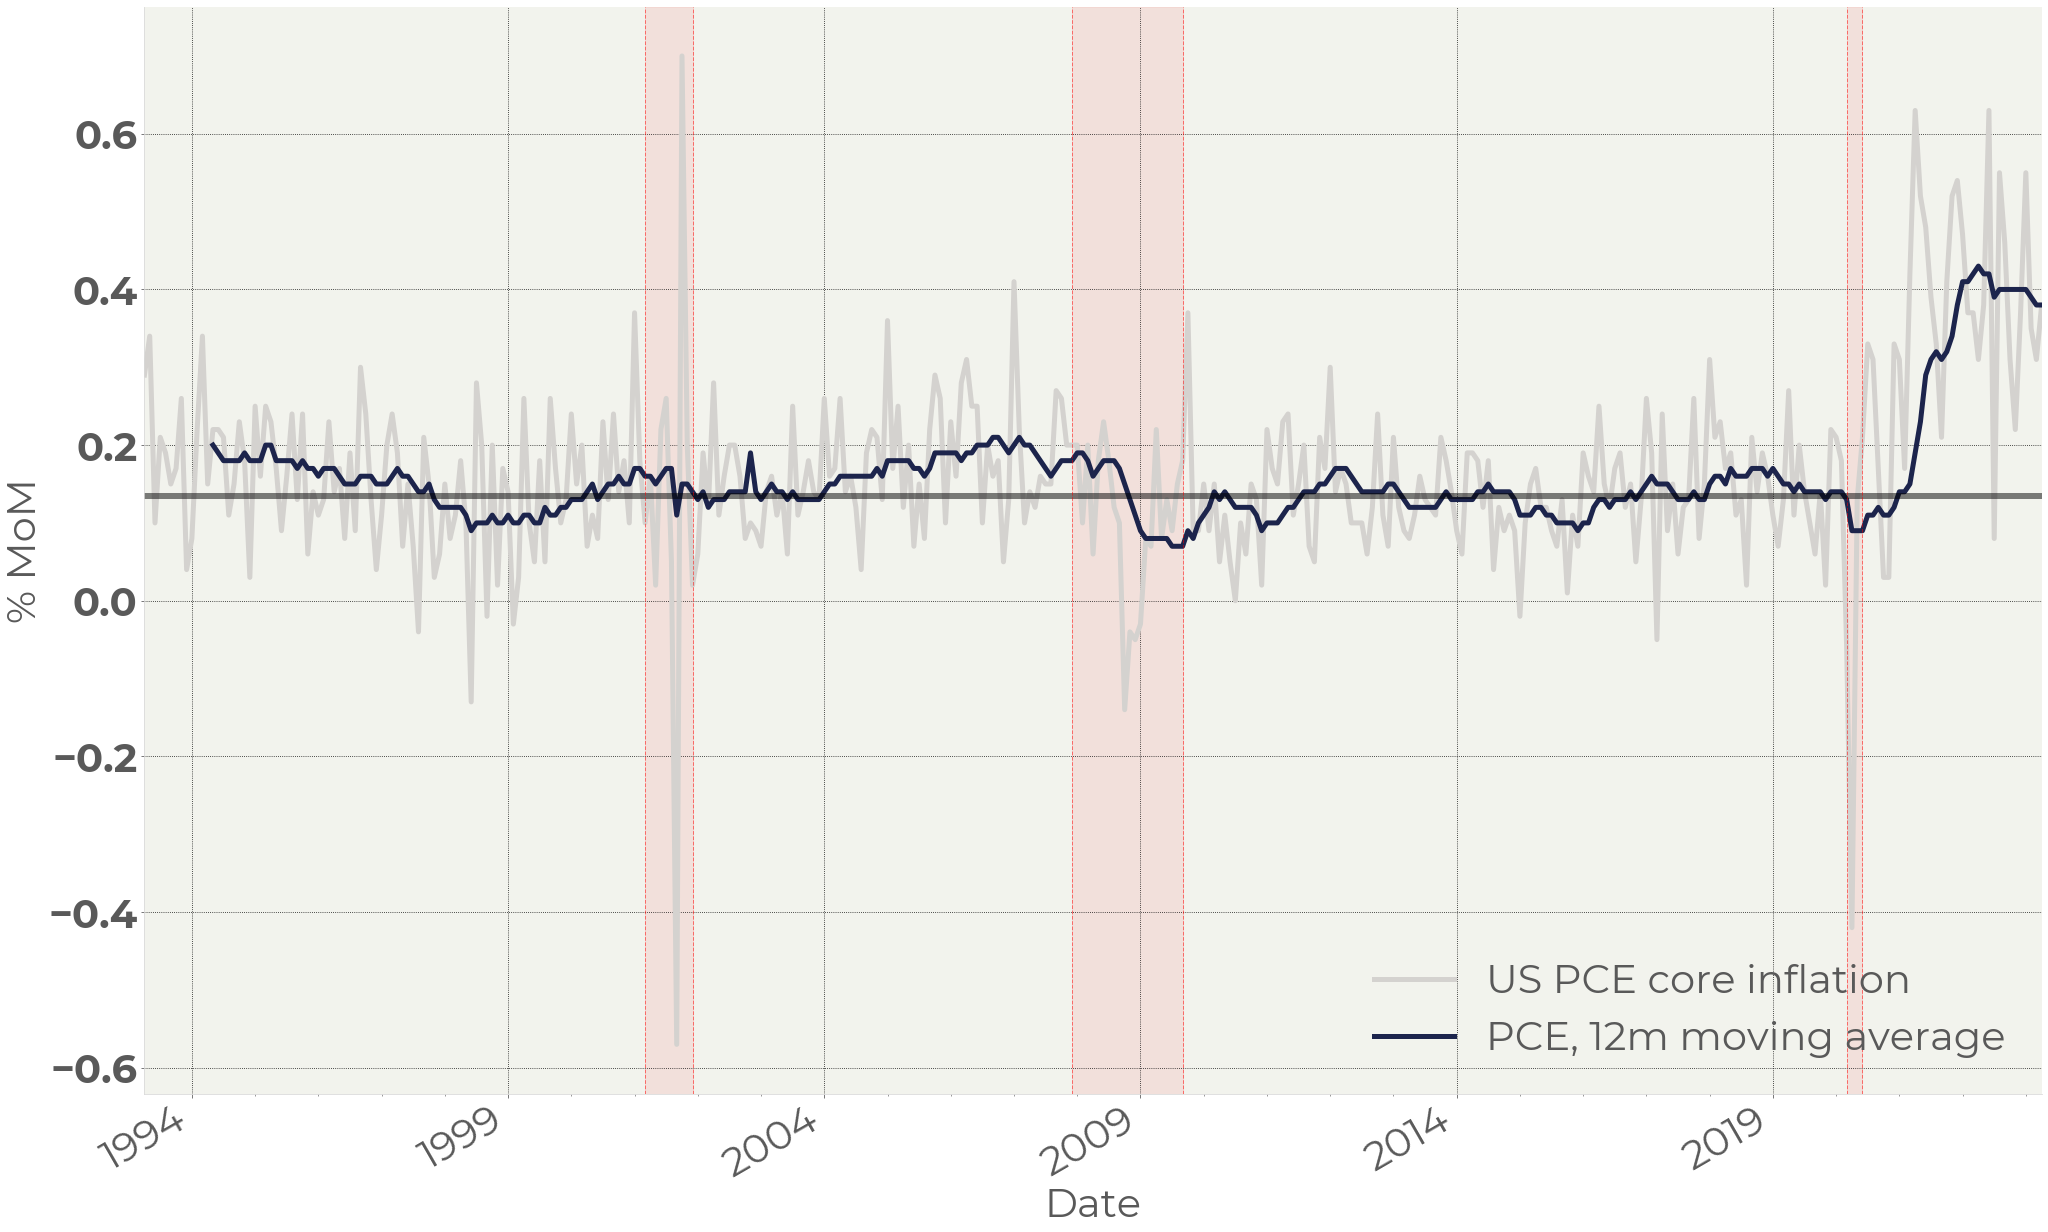
Figure 1 . US PCE core inflation, MoM
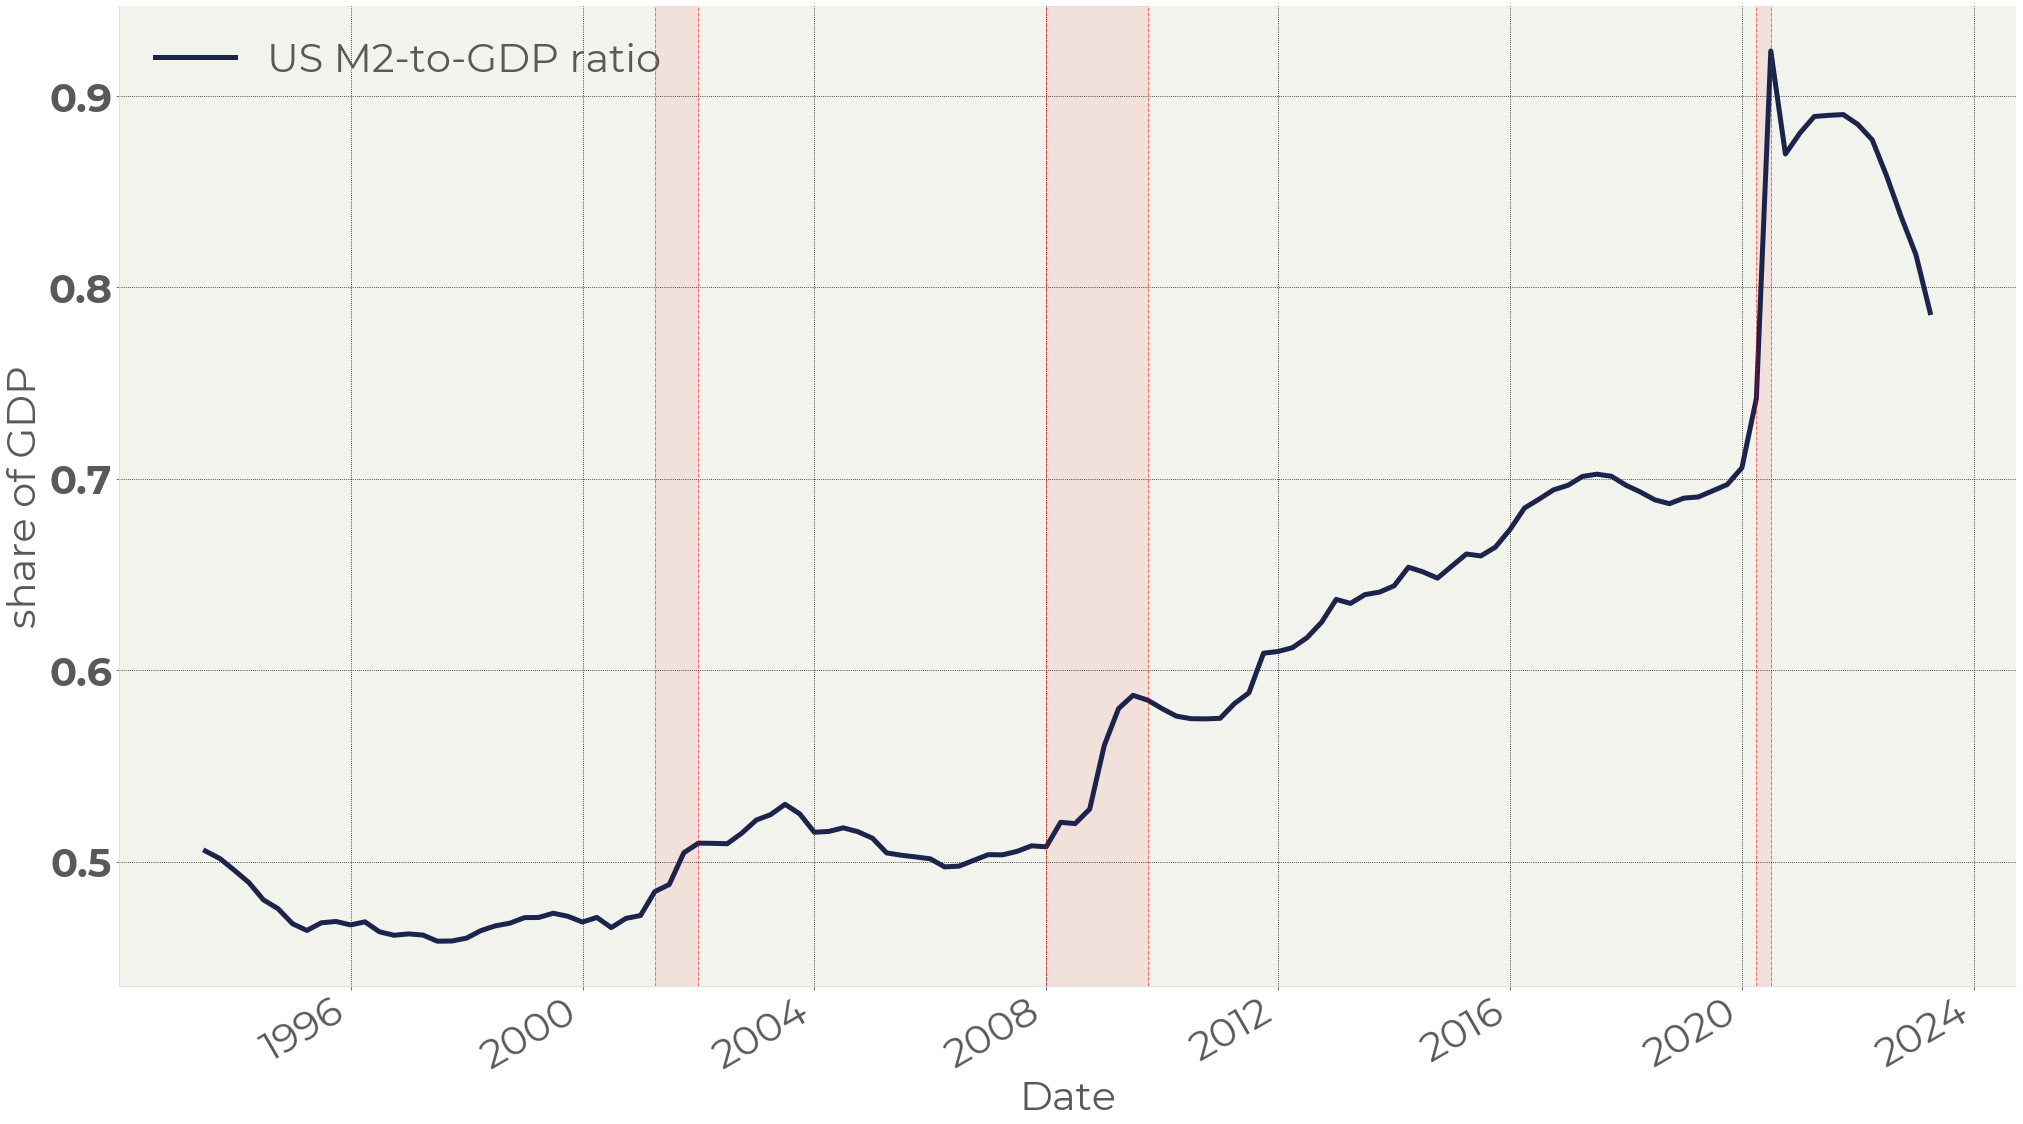
Figure 2 . US M2-to-GDP ratio
Returning to the pre-pandemic level of the monetary mass will take about a year, give or take. This will consist of a 5—6% increase in nominal GDP (mostly due to inflation) and a 4—5% contraction of M2, driven by the Fed selling bonds on the open market.
Inflation, albeit cooling down, is going back down much slower. The high-rate environment and the Fed’s balance sheet contraction resulted in a 20% fall of money in circulation, but it is not affecting the price growth.
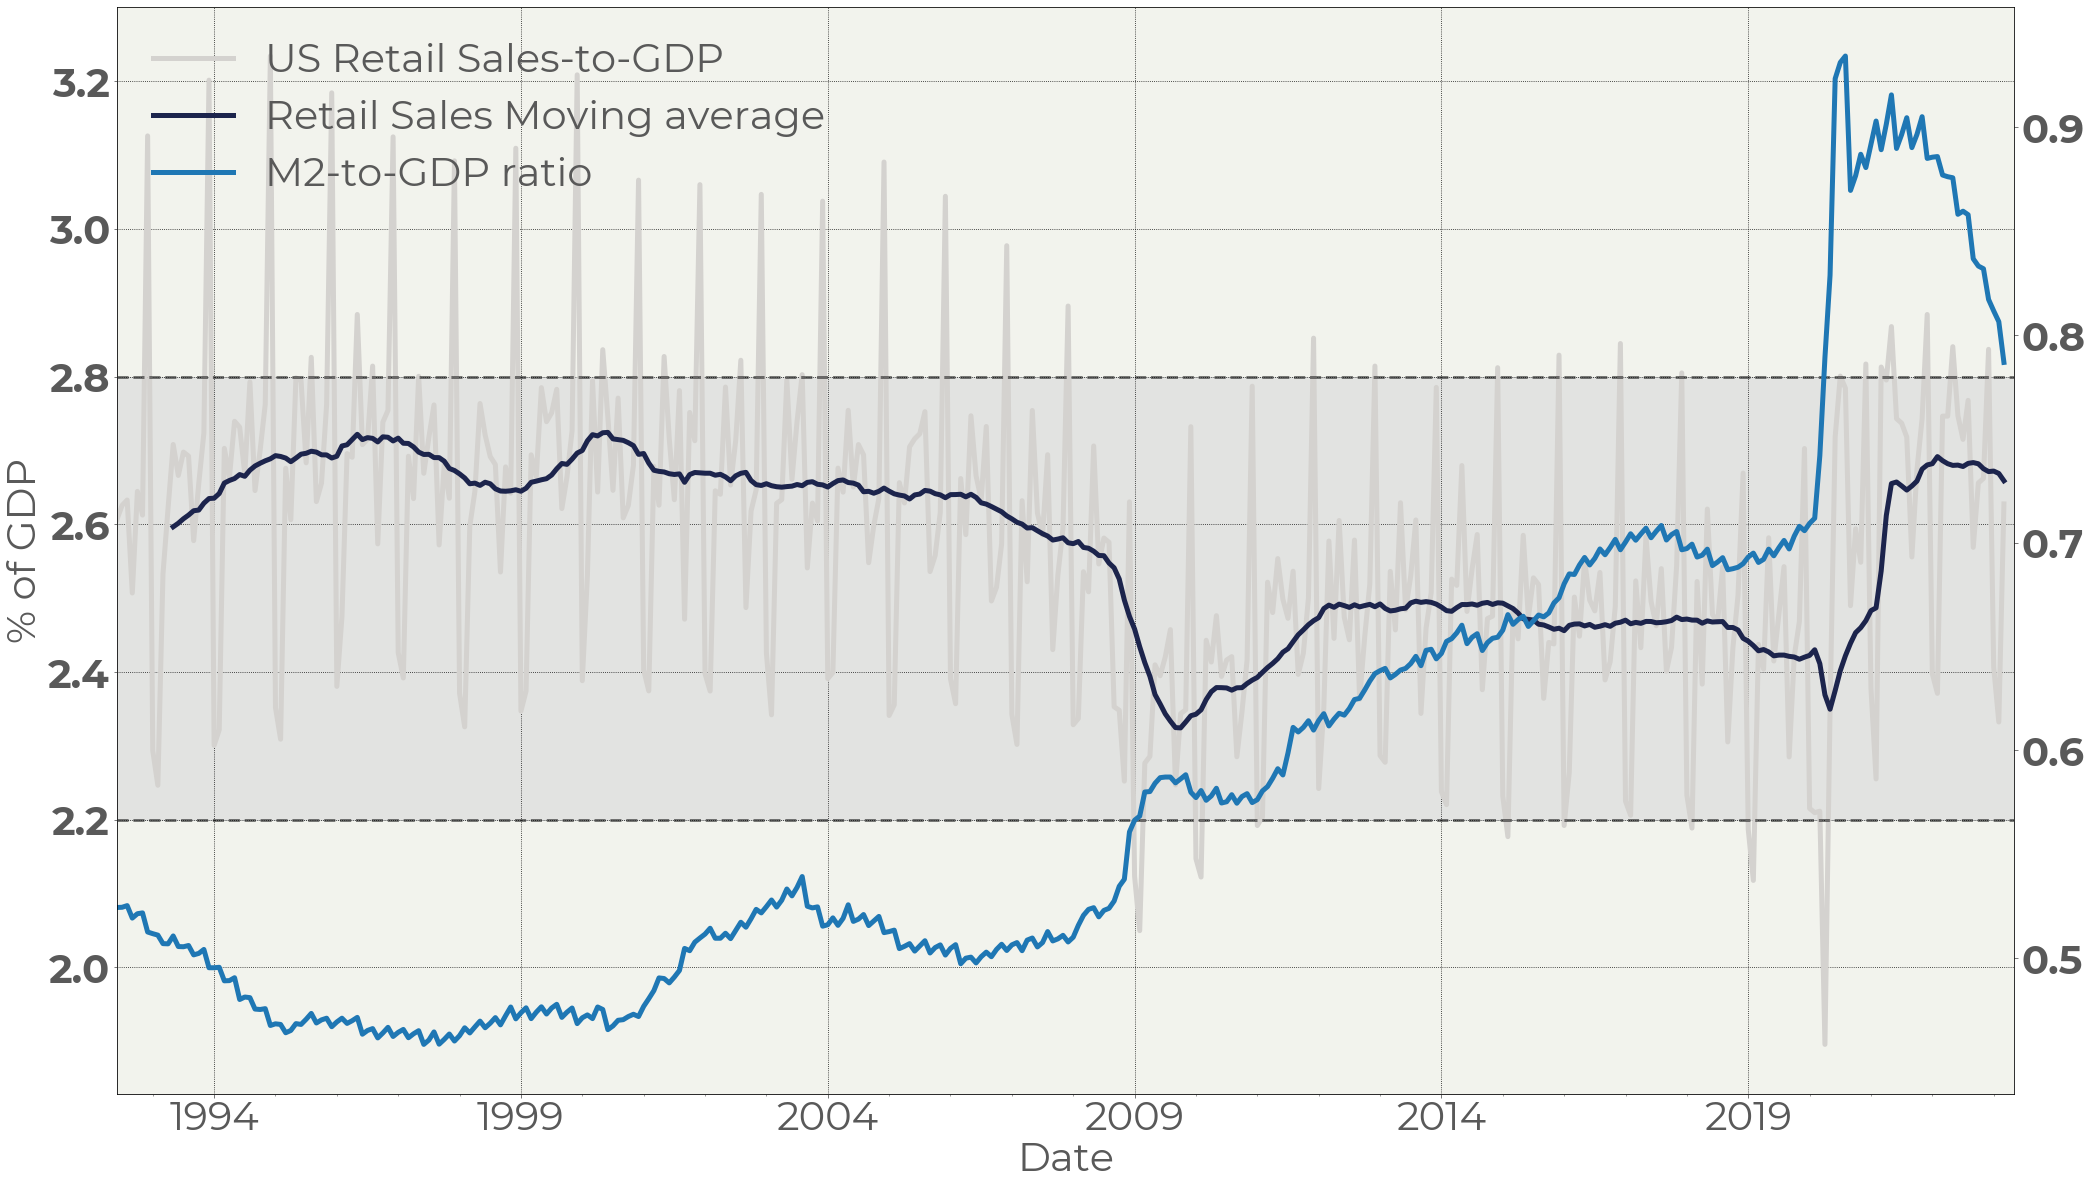
Figure 3 . US Retail sales vs M2-to-GDP ratio
Figure 3 shows how resilient the Retail sales are. Not surprisingly, the elevated level of consumption keeps pushing prices up.
This chart highlights another phenomenon. We can notice that before the pandemic the Retail sales were fluctuating between 2.2% and 2.8% of GDP per month. The top of the range corresponds to the December sales season, the lowest point is February. After COVID the bottom of the range lifted to ~2.4% with the top remaining unchanged.
The top range is limited by the economic capacity: new CapEx is low due to high rates; the labor force is limited by the number of working people. This is why the top of the range is still the same as it was before COVID. The bottom range, though, has moved up, reflecting higher demand caused by monetary emission. This chart shows that demand exceeds the capacity of the US economy. Every time the retail sales hit the top of the range the economy experiences a deficit of goods and services. This causes inflation.
The question remains, though, why after a significant drawdown of the monetary excess the retail sales (or demand, if you prefer) remains largely unchanged.
We see two possible explanations for this.
First, there is the pass-through effect. Cooling down inflation leads to the fall in the commodity market. That drags down prices on energy, letting people spend money that earlier they spent on electricity and petroleum. Moreover, high rates put pressure on motor vehicles and other discretionary goods sales. For instance, the average monthly number of cars sold in 2022 in the US was 1.2m vs 1.5 before COVID. One of the major reasons is that consumers are not ready to take car loans at current rates. Not buying cars, they have free money that was not spent as a downpayment. Part of this money, hence, can be spent on cheaper goods and services.
So, even in high-rate environment there are mechanisms redirecting demand from discretionary goods to staples and services supporting the stickiness of price growth.
The second reason is the solid labor market. Consumers have money, but it is equally important that they are confident enough to spend it. In our view, it is high job offerings and rising wages that maintain high confidence level.
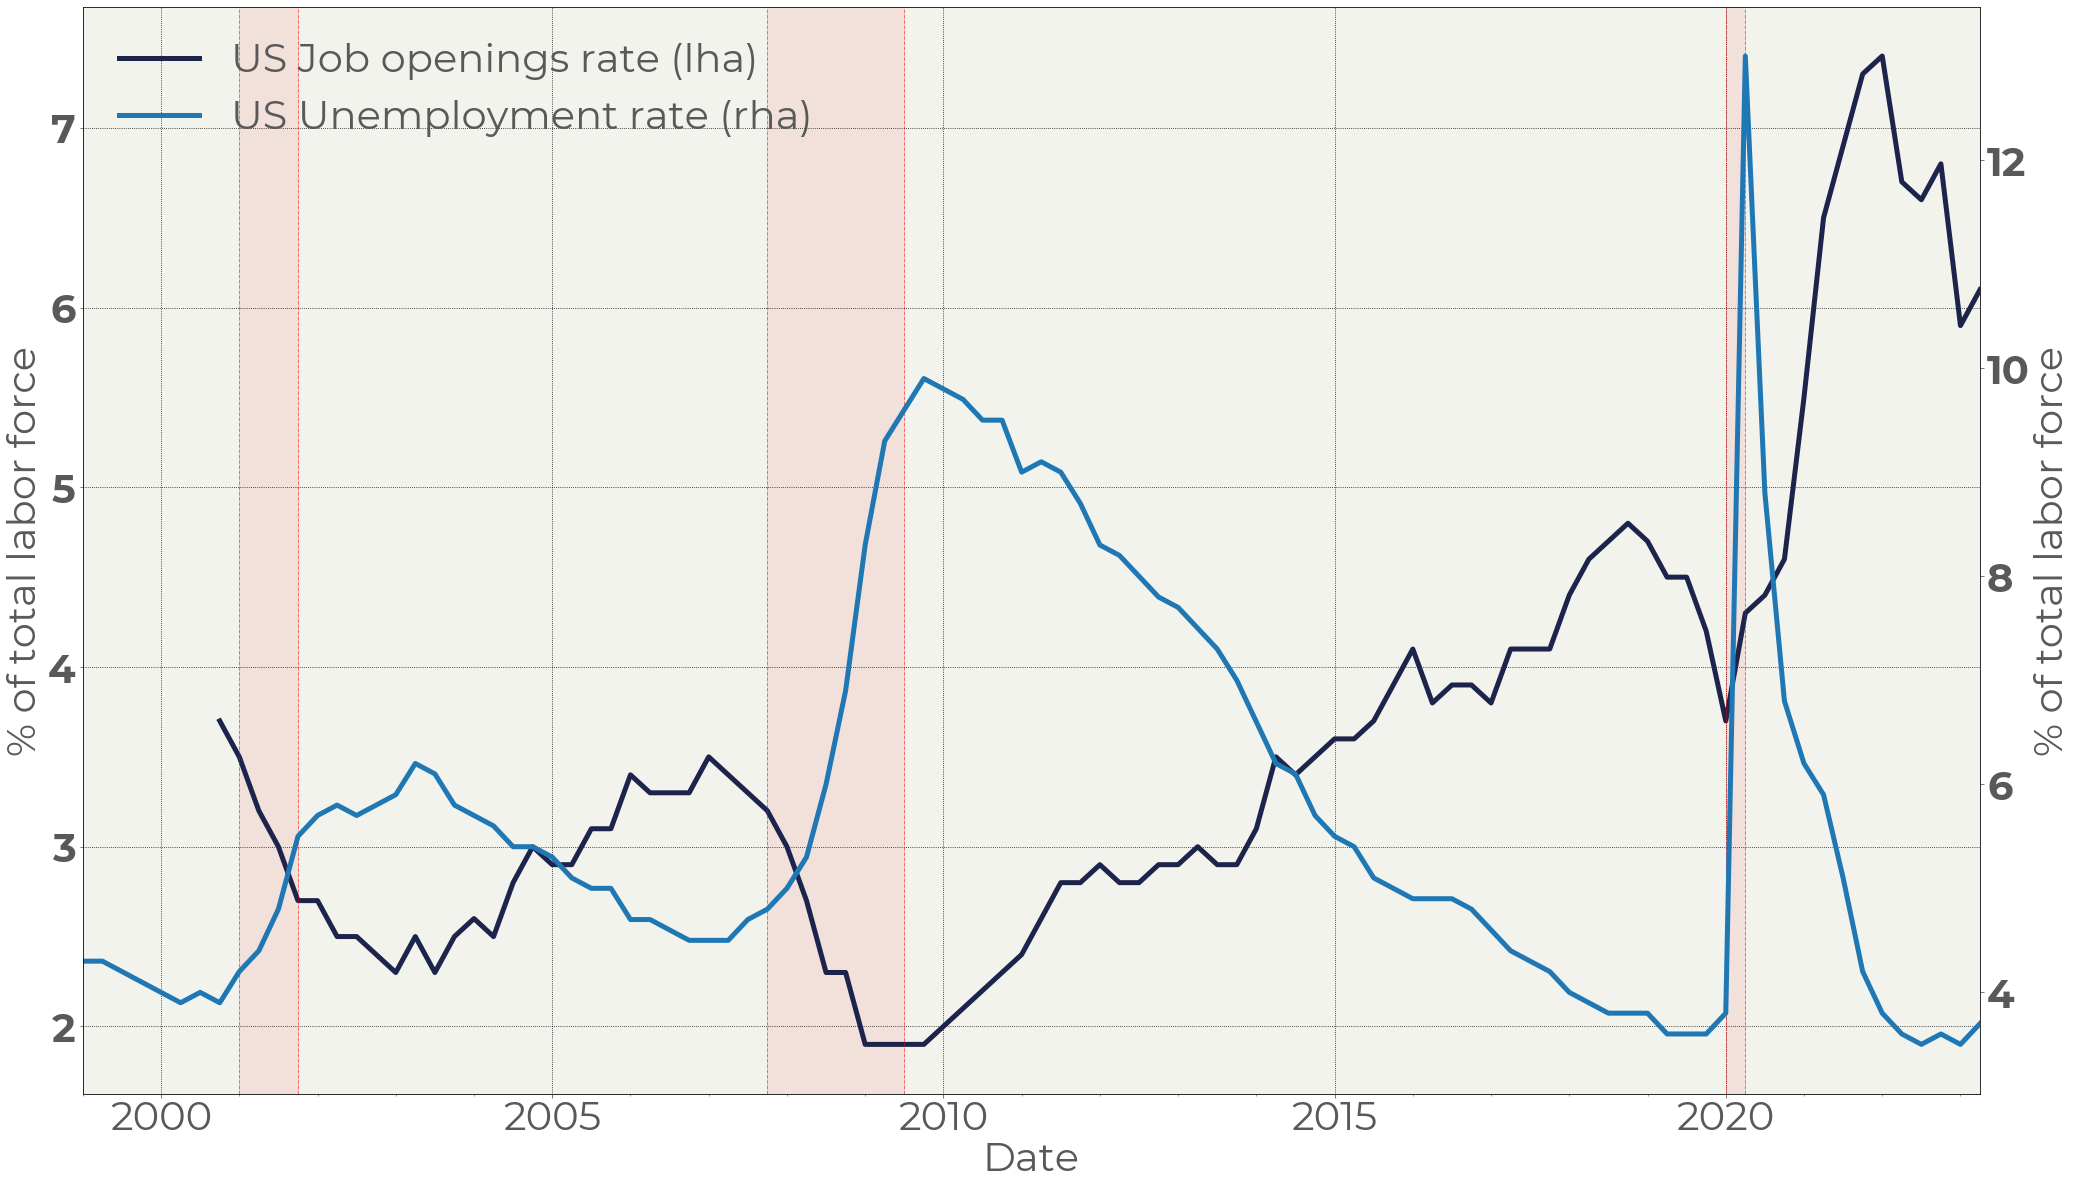
Figure 4. US job opening and unemployment rates
The job openings are falling, but the decline rate is slower than that of the money excess (Figure 2). A possible explanation could be that demand on labor force is not elastic when the economy works near its full capacity. If the quantity of daily visitors to a restaurant increased from 100 to 110, the owner tends to expand its staff to serve clients. Then, even if the number of daily clients decreased from 110 to 105, the restaurant still needs extra staff. Only when the number of daily visits falls below 100, the restaurant will stop hiring and, maybe, start cutting its staff.
Strong demand supports the labor market. The hot labor market, in turn, motivates individuals to spend.
This mechanism sends inflation up, but, on the other hand, it also maintains a high level of demand which prevents the economy from crashing.
In our view, this situation is not stable, and it is a matter of time that demand in the US economy falls.
Corporate profits and consumer spending
It is clear that demand will only decline if consumers are less motivated to spend. A sputtering labor market could incite such a shift. But what could cause a weak labor market while businesses are struggling to hire to meet demand? The answer: wage inflation.
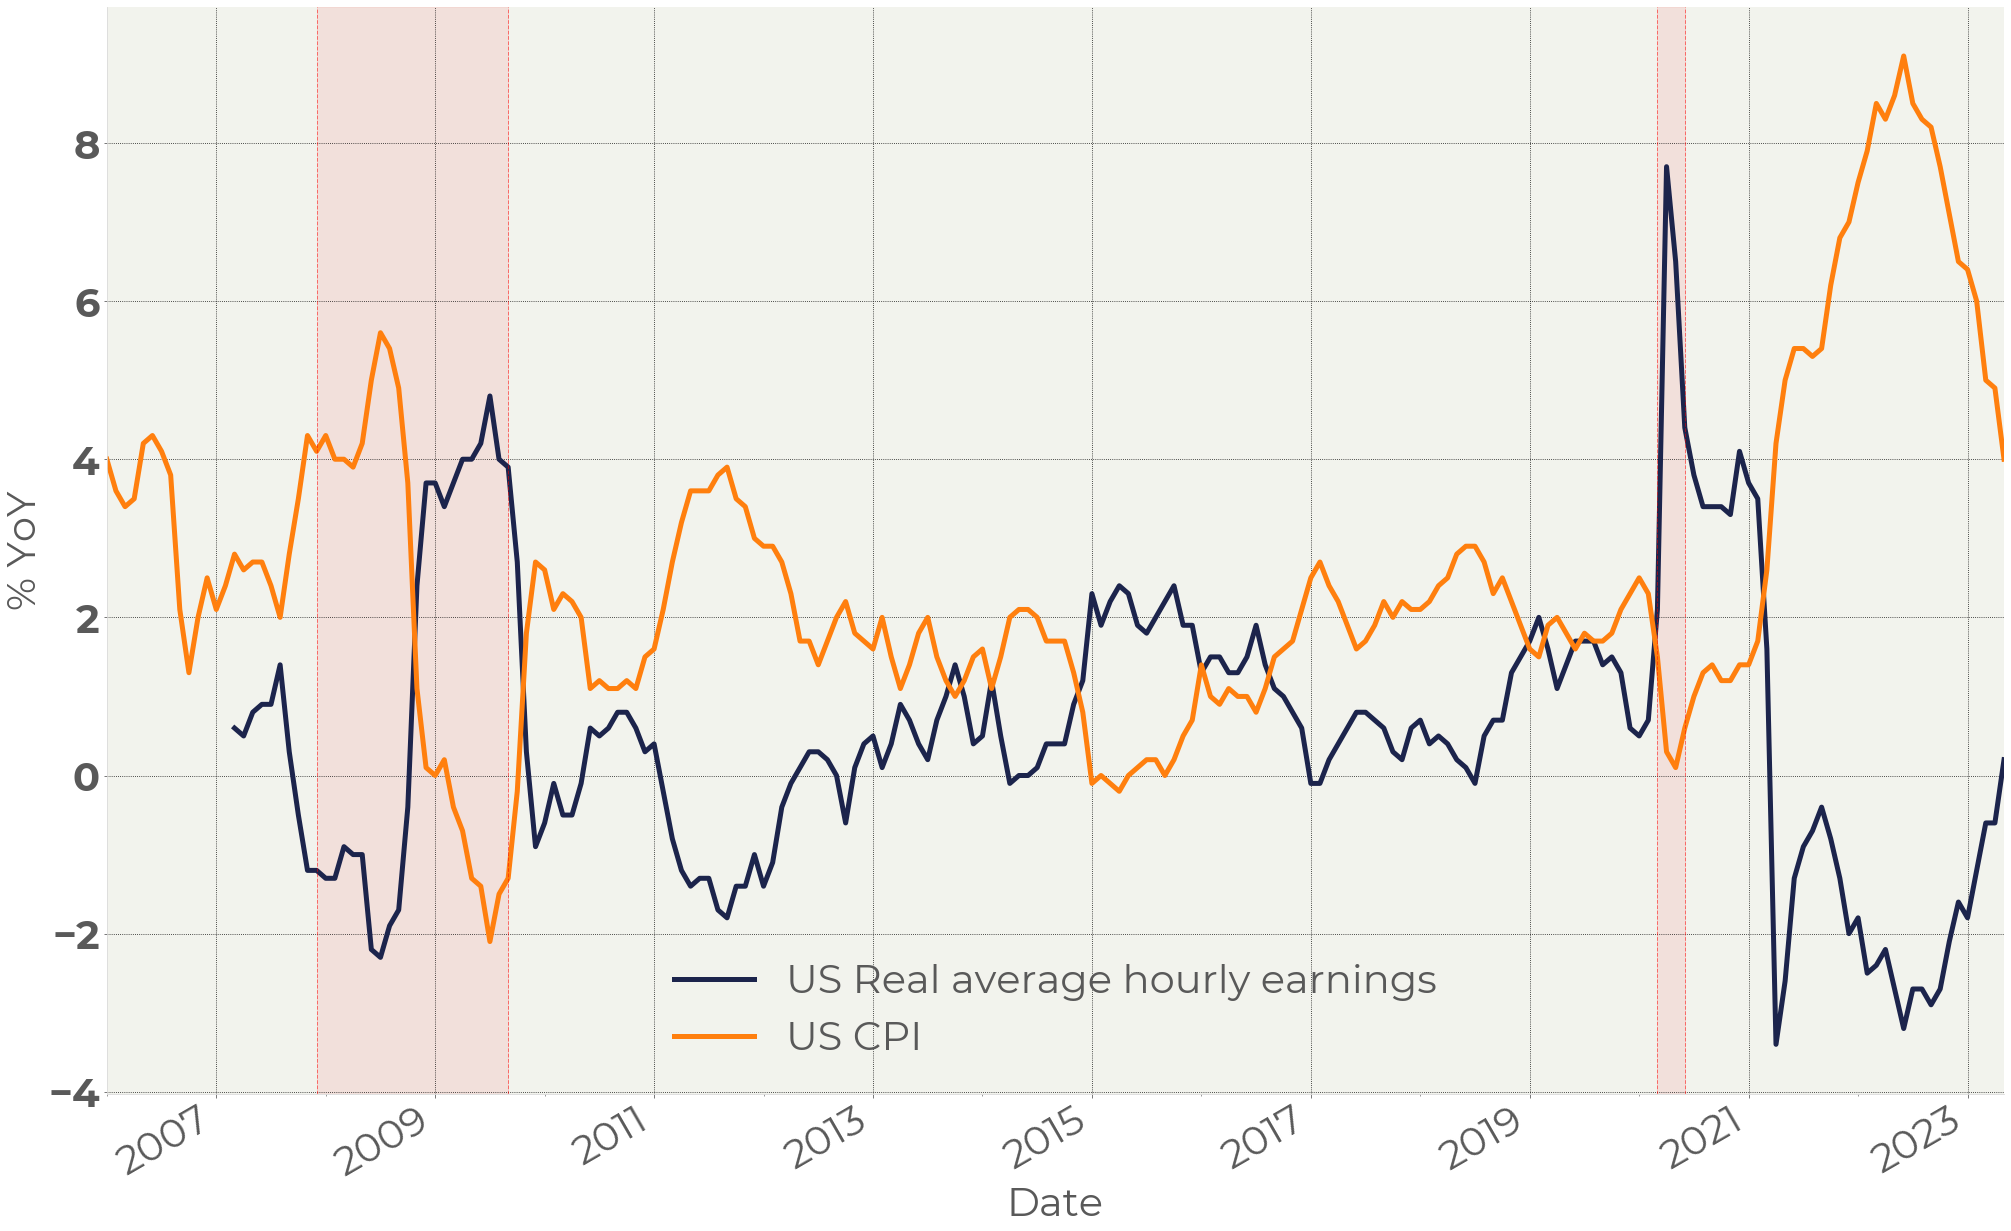
Figure 5 . US Real hourly earnings and CPI
Figure 5 illustrates how wage growth and inflation mirror each other. Wages consistently lag behind inflation: price spikes always benefit corporations first, driven by demand. Nominal wages move sluggishly, resulting in real wages declining in inflationary environments. Consequently, the workforce becomes relatively cheap. This pushes demand in the labor market up, leading to uptrends in real wages. These uptrends begin when inflation reverses and continue until inflation normalizes.
If this pattern holds, wage growth will persist until CPI hits and stabilizes at a target level of 2%. Therefore, we can infer that while falling but still high inflation puts pressure on corporate profits, the stickier the inflation, the more pressure it will exert.
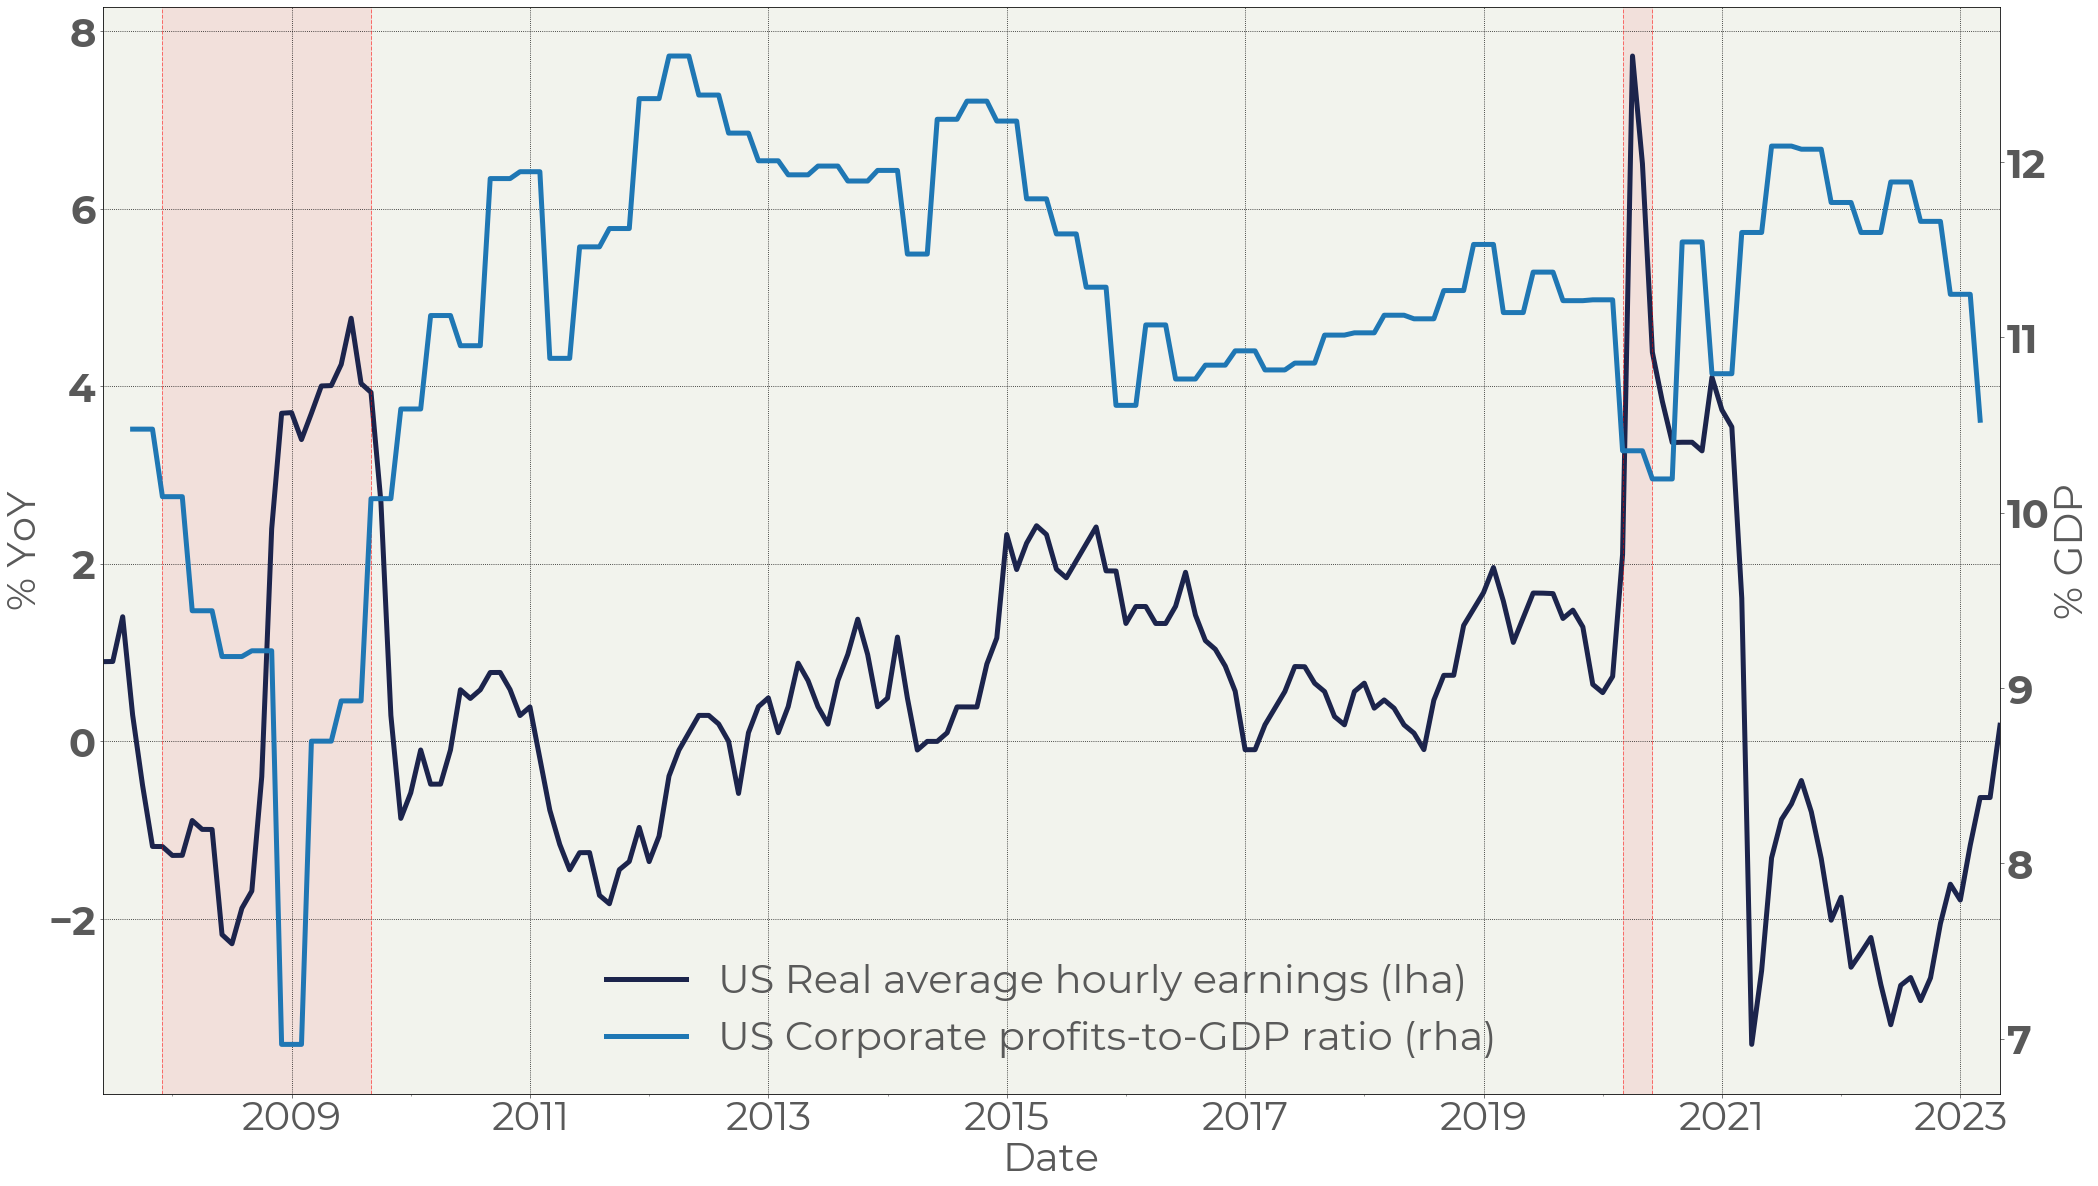
Figure 6 . US hourly earnings vs corporate profits
Figure 6 depicts an inverse correlation between wages and corporate profits. If our assumption that wages have a long way up holds true, the same should apply to corporate profits, but in the opposite direction. Figure 7 offers a slightly different perspective, comparing the US net corporate profit margin and the corporate profit-to-GDP ratio. It shows that the anti-pandemic monetary emission propelled corporate margins to a record level.
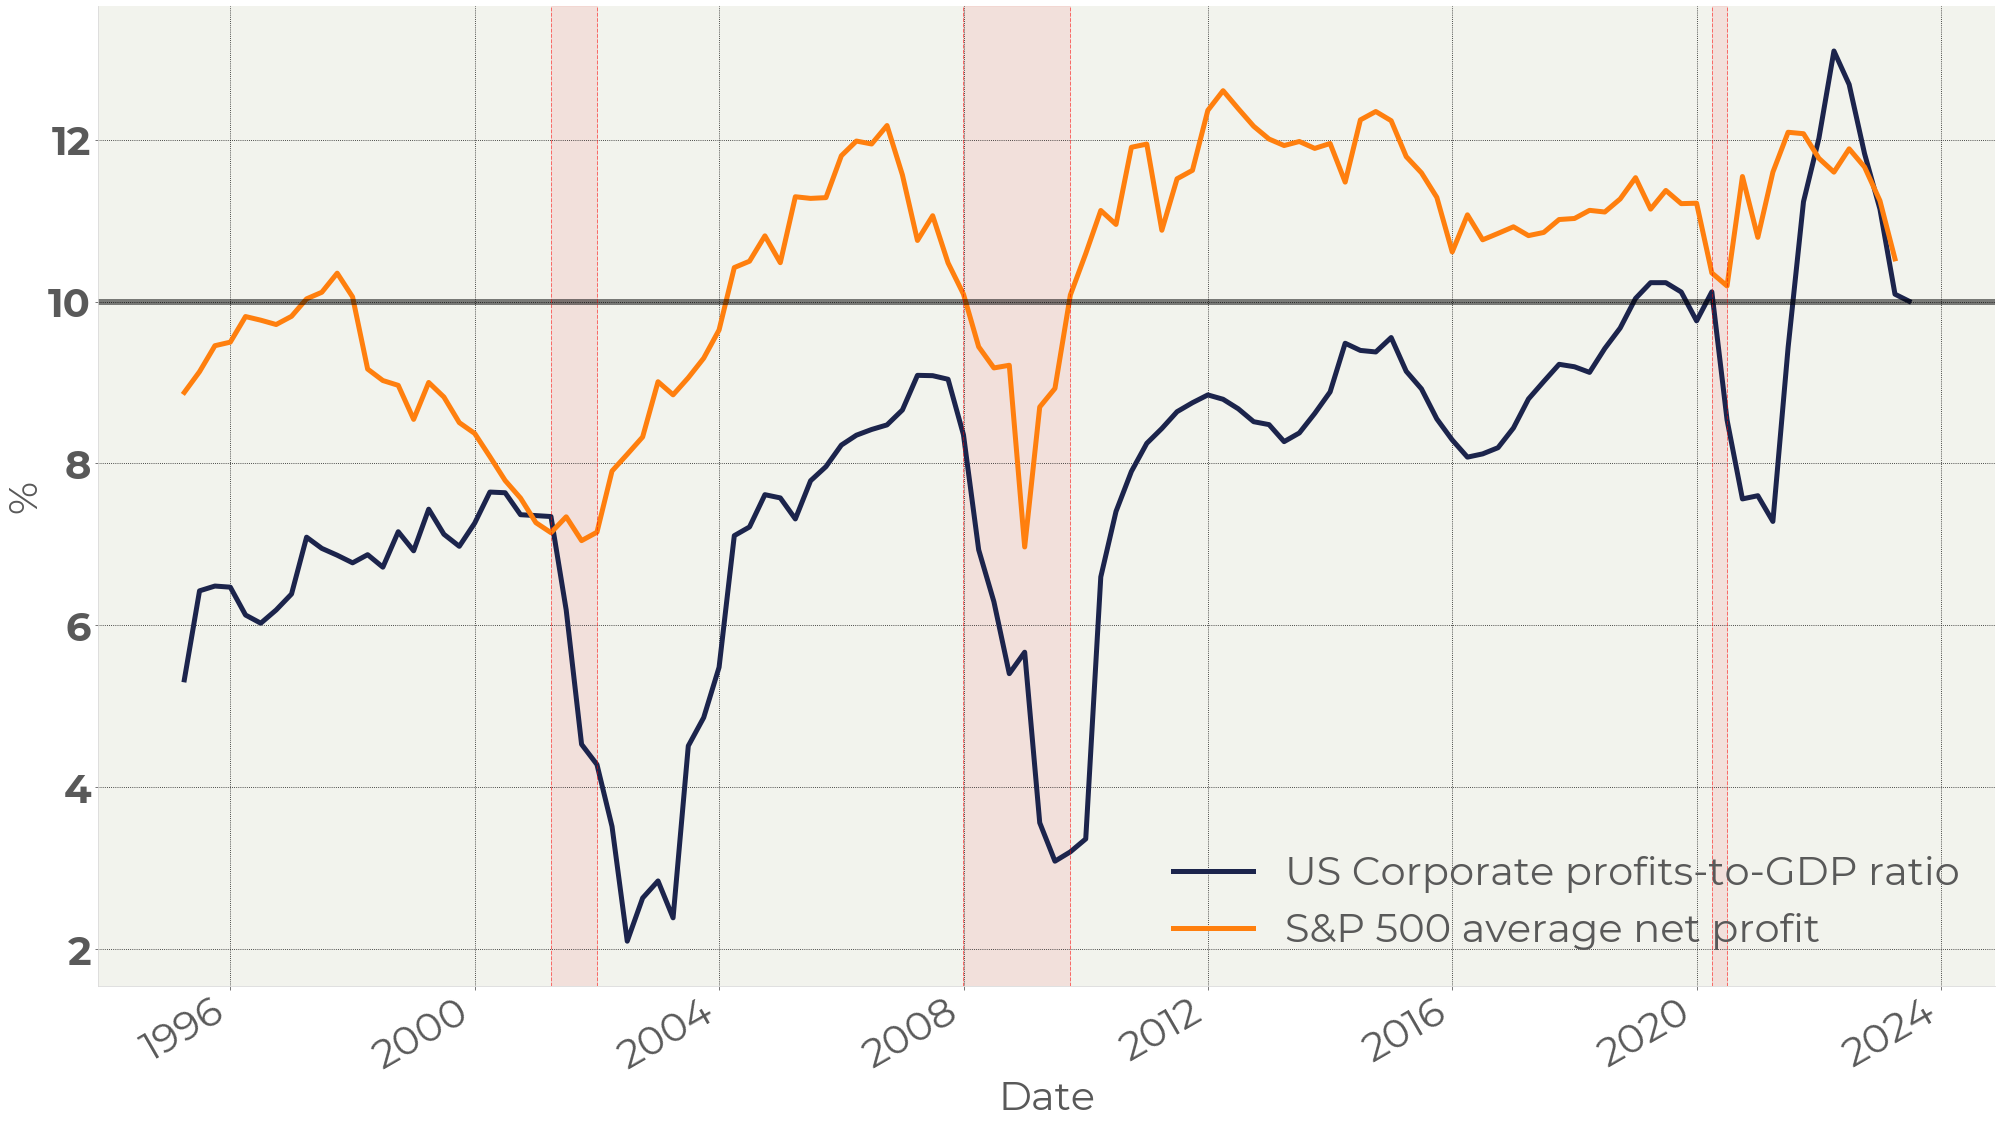
Figure 7 . US corporate profits and average S&P profit margin
Now, as the situation returns to normal, there is a substantial room to decline. However, this does not necessarily imply that the market should crash.
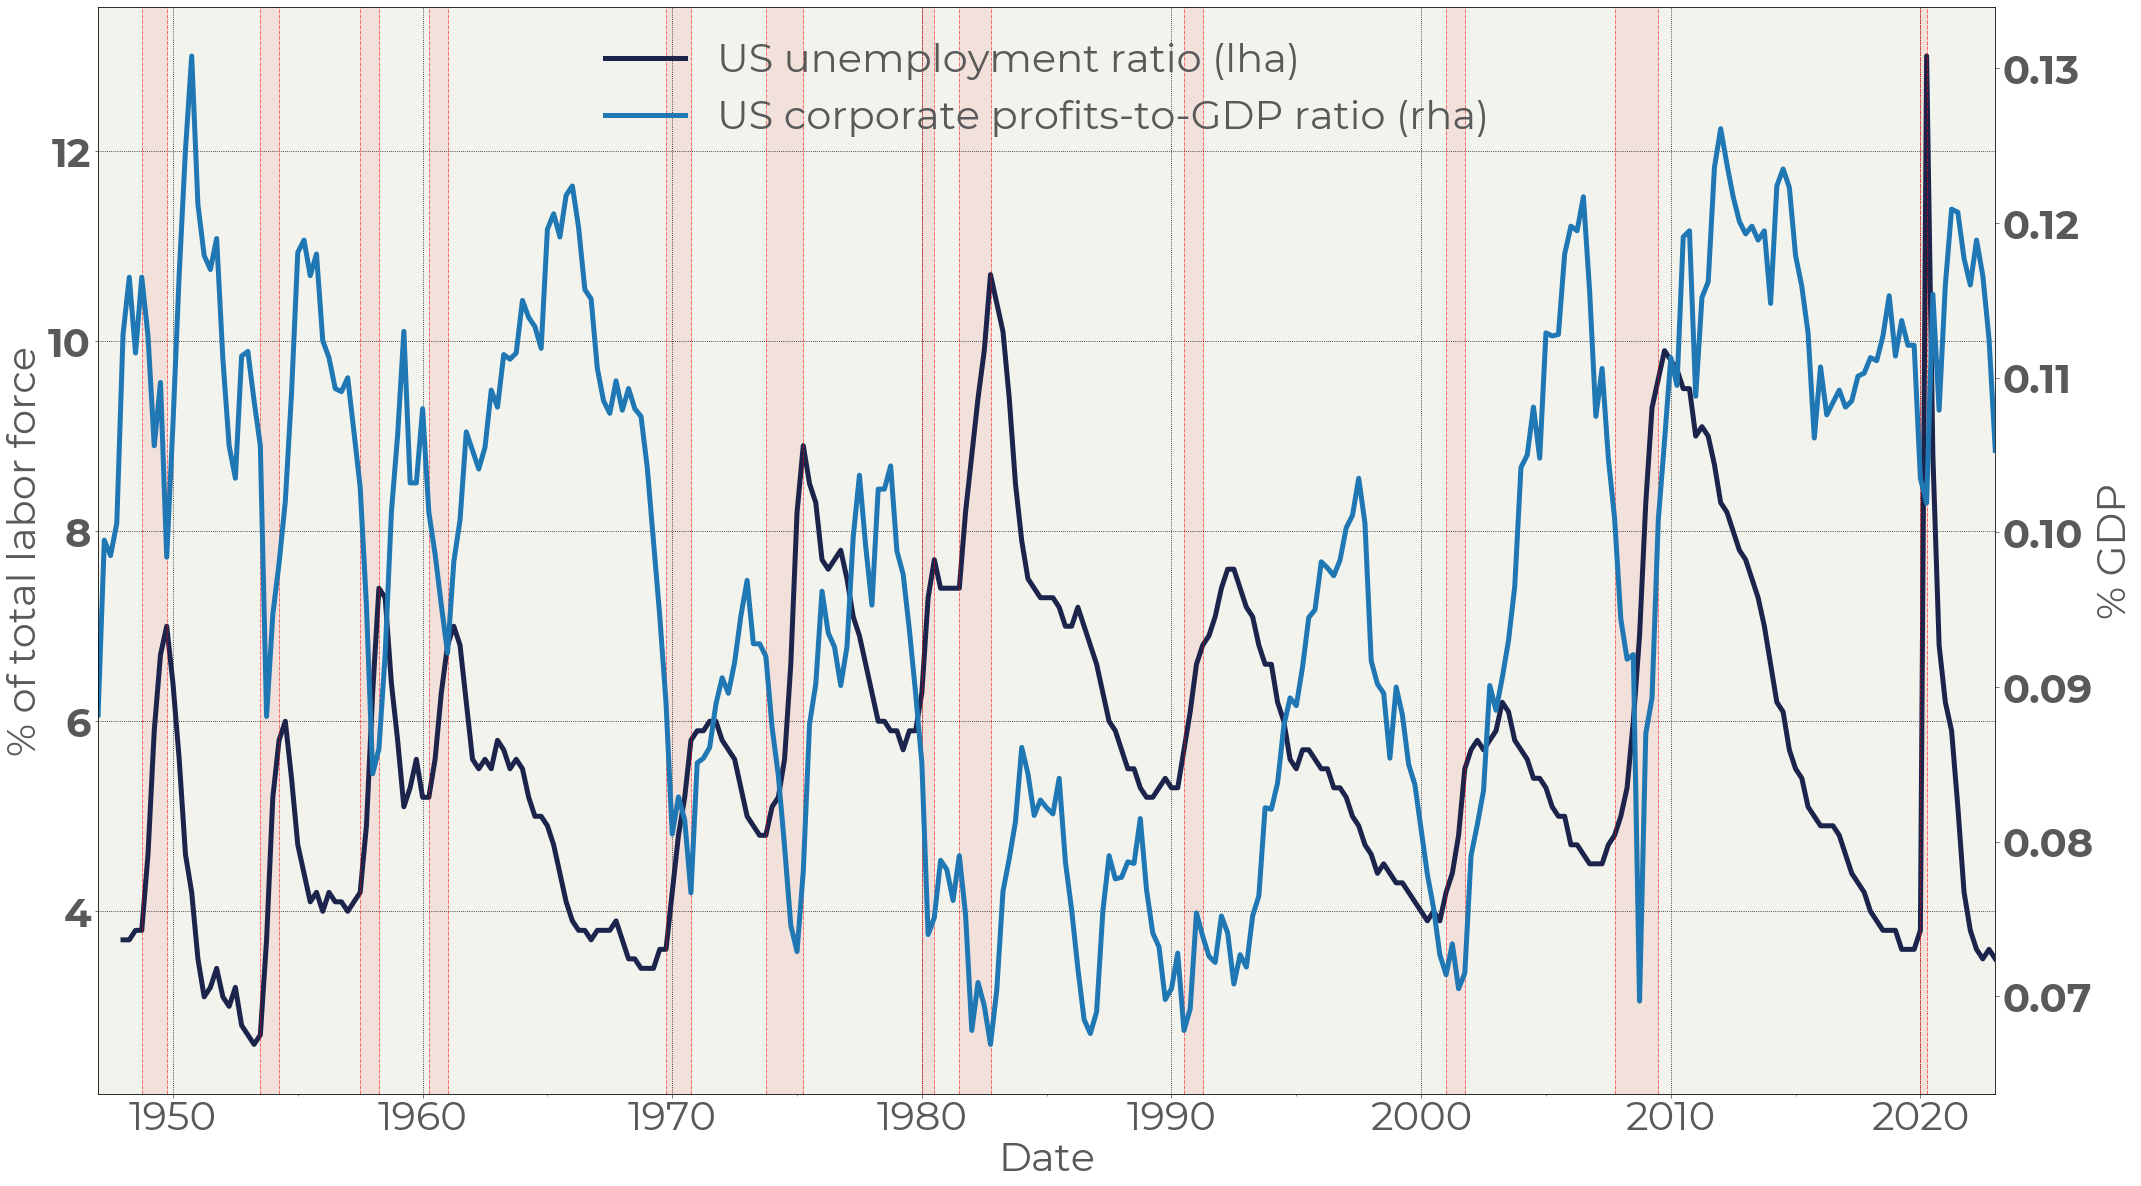
Figure 8 . US unemployment vs corporate profits
The problem arises when corporate profits fall below a critical threshold, prompting companies to protect their earnings by cutting staff (Figure 8).
We are far from that point currently. Companies are still hiring, wages are growing, and consumer demand is strong. While consumer demand exceeds economic capacity, there's no danger of this changing. But consumer demand is slowing. If (or when) it falls below economic capacity, businesses will become sensitive to staff costs. Then we could see sudden staff cuts, a drop in job openings, and a surge in unemployment. This would represent a hard landing.
The crucial questions are, to what level will corporate profits drop and will this trigger protective corporate profit measures through staff cutting?
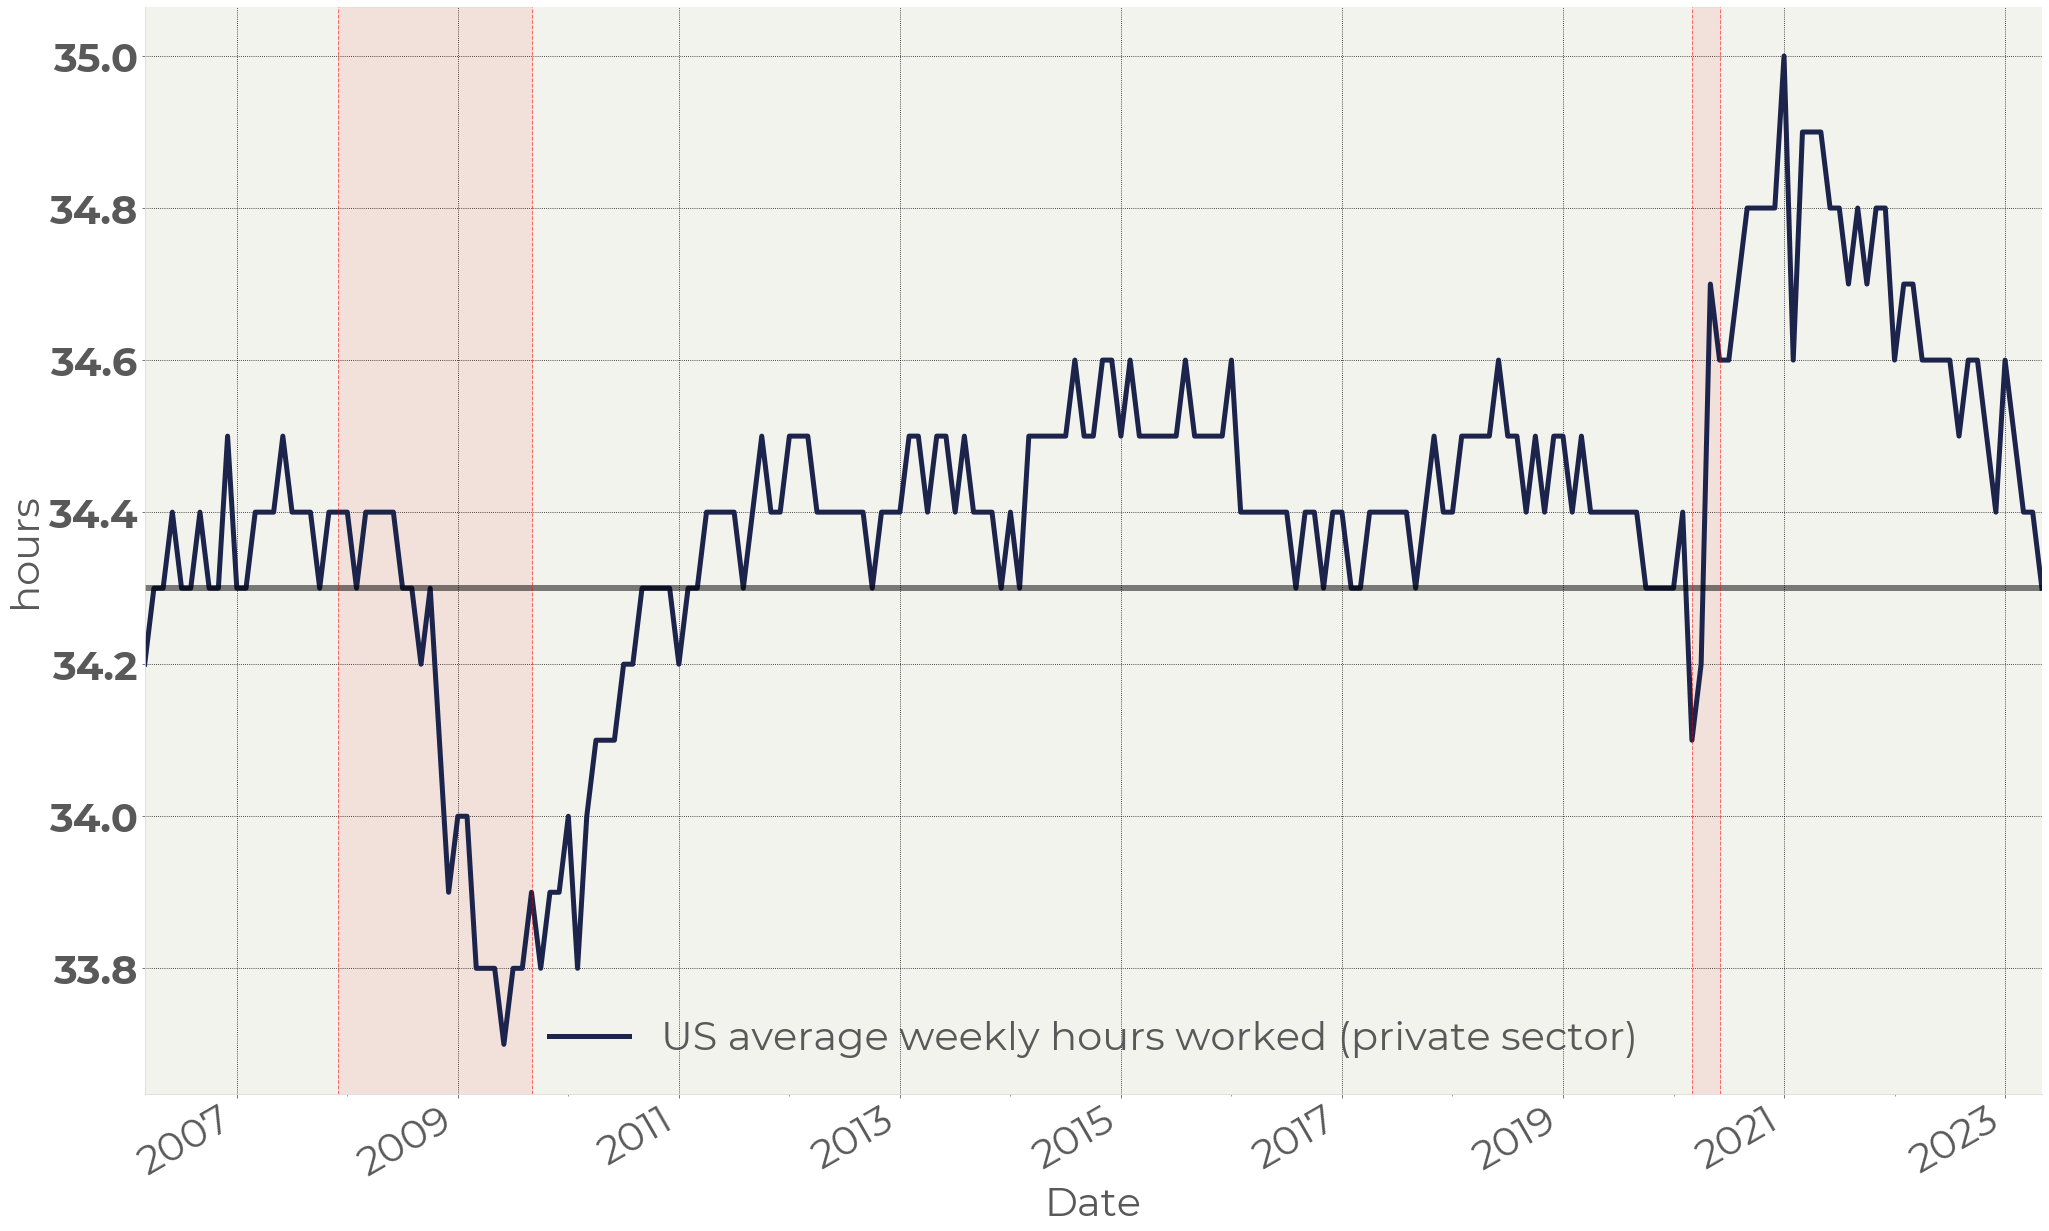
Figure 9 . US average weekly hours worked (private sector)
Figure 9 indicates that we are already near a dangerous level. A year ago, average weekly hours in the US economy were high, reflecting the imbalance between demand and workforce. Now, working hours are at a historically low point, suggesting that supply and demand are nearing a balance. This data provides an early warning of potential developments in the near future.
Current market condition
The US property market and car sales have rebounded from the lows reached in Q4 2022. The housing market's recovery hasn't been accompanied by a surge in mortgages, indicating that savings are the primary source of demand in the real estate market. The principal driver of this demand is consumer confidence, buoyed by a strong labor market and growing wages. Additionally, the average sales price of existing homes in the US plunged 20% in H2 2022, which could also have spurred demand. If so, we might witness a speculative wave that will evaporate as soon as houses become more expensive and property prices cease to rise.
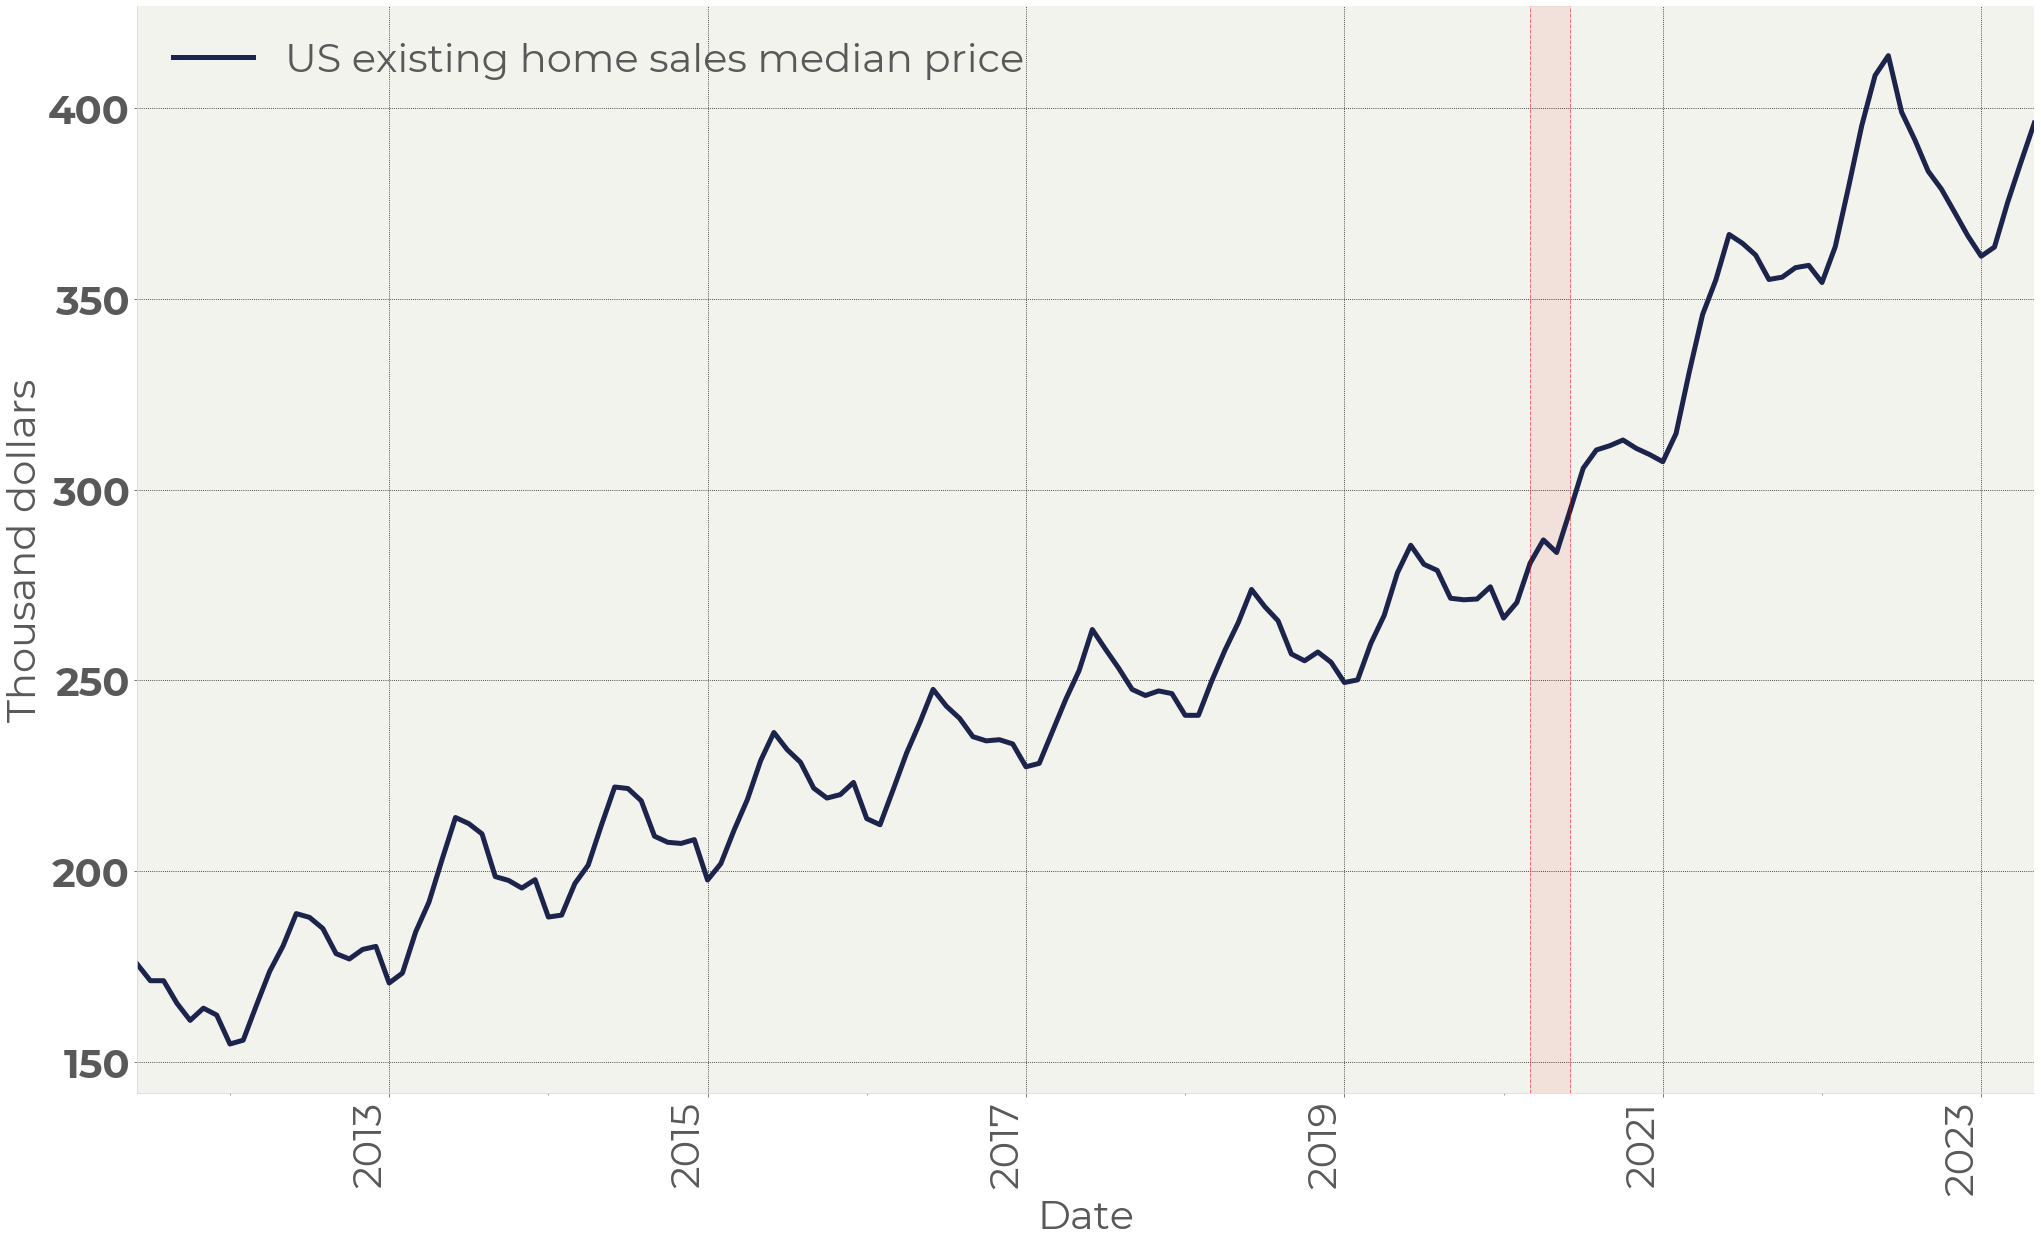
Figure 10 . US Existing home sales median price
Home sales are seasonally cyclical, with June being the peak month. For this reason, rising house prices say nothing about the state of the economy. Moreover, H1 is considerably weaker in 2023 than in years before (Figure 10). Despite the partial recovery, the real estate market is more weak than strong.
In summary, the current market condition reflects several factors:
· Wages are growing due to strong demand and the relative cheapness of the workforce, which stimulates consumption.
· Retail sales remain strong and persistent.
· The housing and car markets are recovering.
· The stock market is growing albeit from a very low base at the end of 2022.
· Expected recession has not happened yet.
This creates a positive perception. However, home sales are weaker than usual, the recovery is seasonal, and is likely to peak in June. The surge in demand is likely to be a one-off effect while from a longer-term perspective demand is going to be under pressure due to high rates.
The strength in retail sales is not seasonal and continues to be robust. Growing wages and ongoing hiring in the labor market support consumers' intention to spend. But the flip side of this process is pressure on corporate margins. Falling corporate margins will bring about deterioration in demand sooner or later. The longer demand remains high the faster consumers spend their savings and the more abrupt the subsequent fall in demand could be.
In the coming months, our attention will focus on retail and home sales: any weakness in these gauges could indicate that the situation is starting to change. Corporate reporting, in turn, will demonstrate if there are signs of earnings pressure due to staffing costs.
Summary
Current economic conditions appear strong, fostering a positive perception of the financial markets. However, this review highlights that this strength results from several factors, many of which are temporary. Moreover, the interplay between the labor market and retail sales helps maintain economic activity in a 'hot' zone, creating an imbalance between the monetary environment and consumer demand. Like other imbalances in financial markets, this can lead to a strong risk-off wave. For this reason, we should take with caution the apparent strength of the economy. If it is caused by the intention to spend the last savings of consumers on the back of a strong labor market, further normalization of demand can be a trigger causing risk-off.