
|
Event |
Period |
Survey |
Actual |
|---|---|---|---|
|
GDP Annualized QoQ |
1Q T |
1.40% |
2.00% |
|
Personal Consumption |
1Q T |
3.80% |
4.20% |
|
GDP Price Index |
1Q T |
4.20% |
4.10% |
|
Core PCE QoQ |
1Q T |
5.00% |
4.90% |
|
Initial Jobless Claims |
24-Jun |
265k |
239k |
|
Continuing Claims |
17-Jun |
1765k |
1742k |
|
Pending Home Sales MoM |
May |
-0.50% |
-2.70% |
|
Pending Home Sales NSA YoY |
May |
-20.50% |
-20.80% |
|
Personal Income |
May |
0.30% |
0.40% |
|
Personal Spending |
May |
0.20% |
0.10% |
|
Real Personal Spending |
May |
0.10% |
0.00% |
|
PCE Deflator MoM |
May |
0.10% |
0.10% |
|
PCE Core Deflator MoM |
May |
0.30% |
0.30% |
|
MNI Chicago PMI |
Jun |
43.8 |
41.5 |
|
U. of Mich. Sentiment |
Jun F |
63.9 |
64.4 |
|
U. of Mich. Current Conditions |
Jun F |
68 |
69 |
|
U. of Mich. Expectations |
Jun F |
61.3 |
61.5 |
Figures that came in on 29th and 30th of June pushed equities up. The first impression is that the economy is stronger than expected with the inflation cooling off.
The top four lines describe the first quarter. It is not quite relevant for the current market because of the big lag, but, anyway, it cannot spoil the market perception.
We would highlight an interesting combination of personal income and personal spending: income is growing, spending is falling. It sets the stage for both inflation coming down and resilient demand – this explains the nature of the GDP figures.
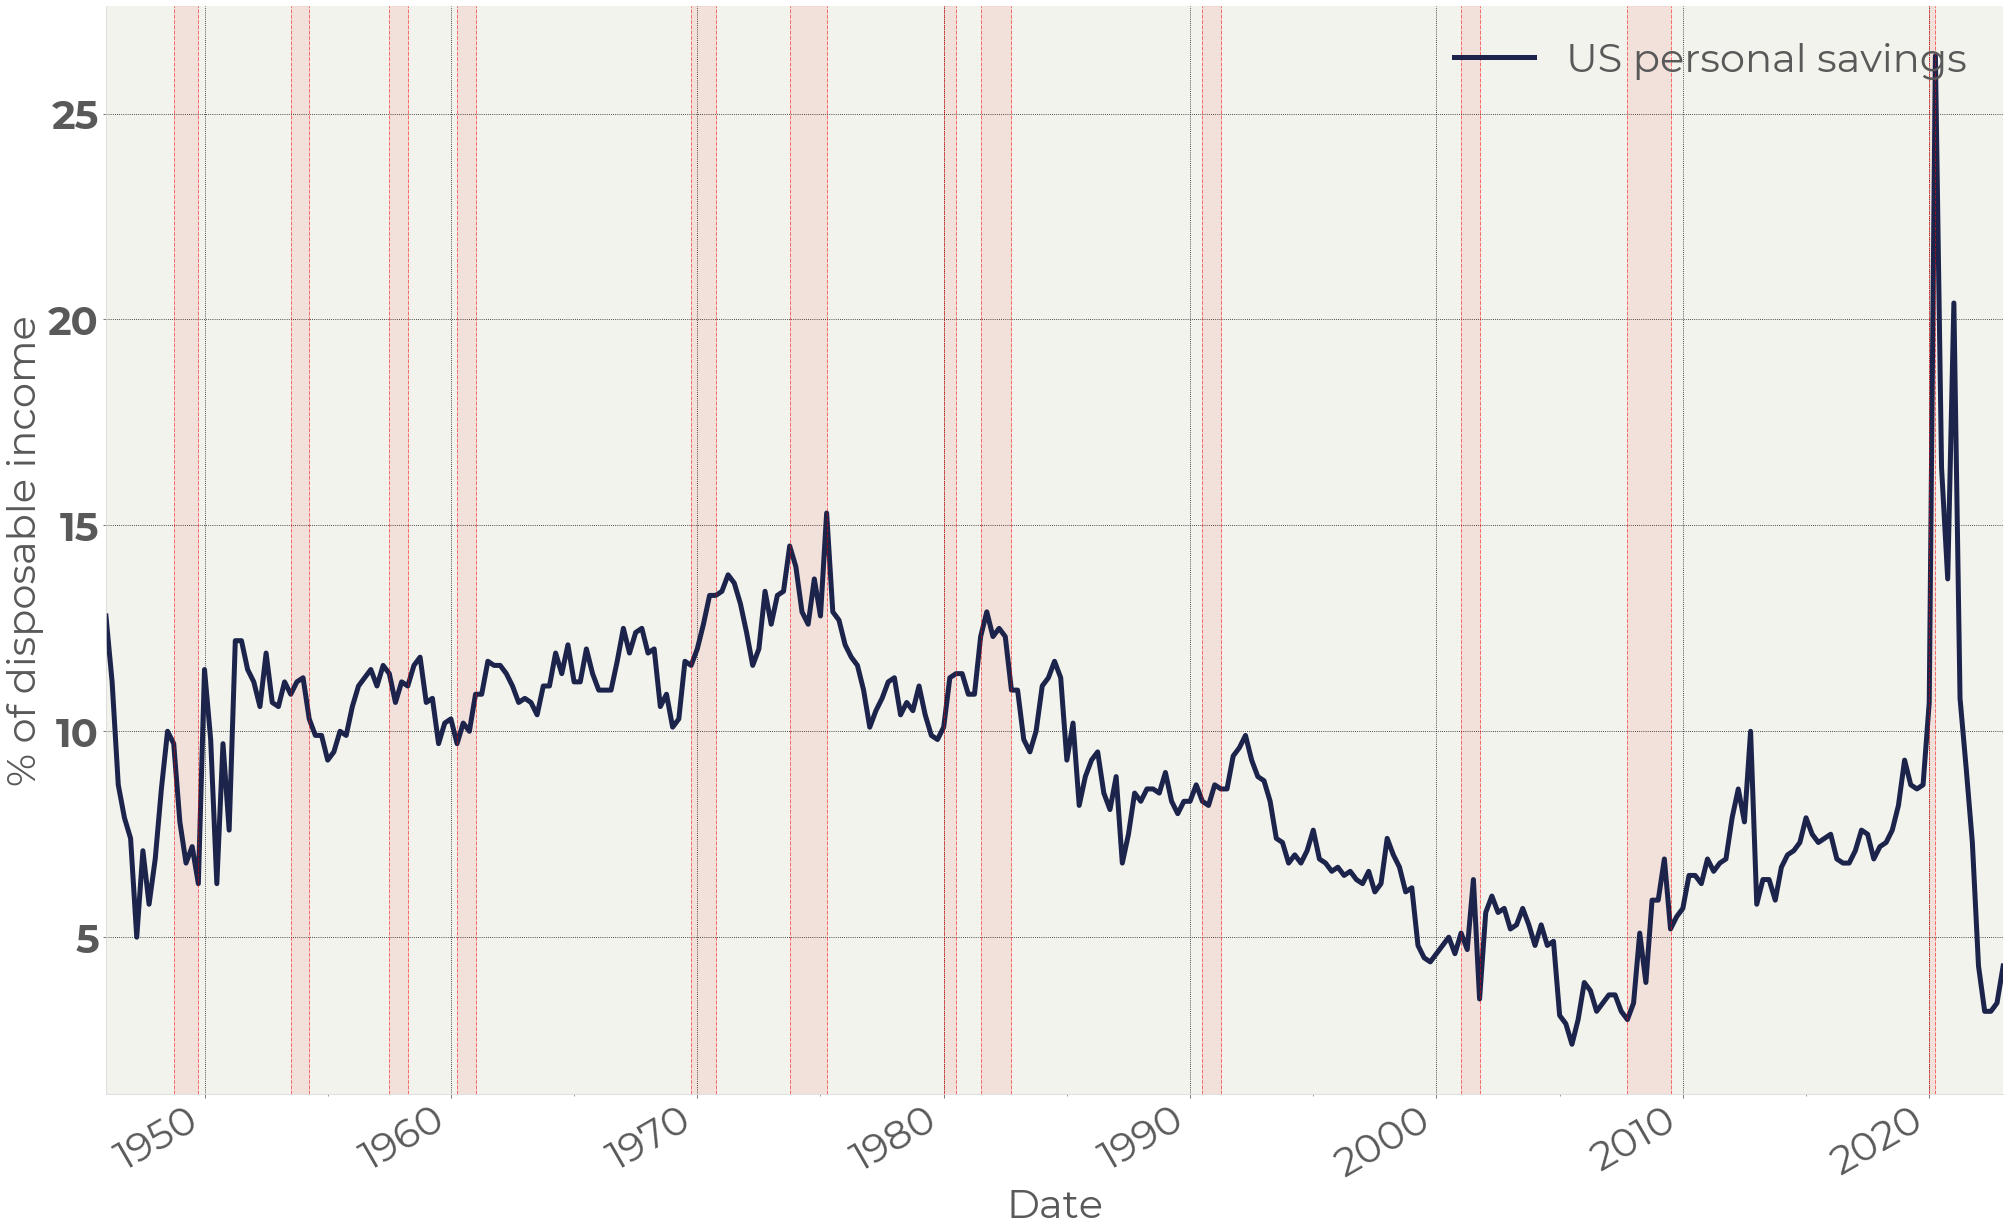
Figure 1. Personal savings as % of disposable income
These numbers confirm the tendency we can observe in personal savings. The inflation spike hit household budgets so that they were forced to spend much more than they had been accustomed to earlier. Now savings are growing mirroring normalization of the situation.
However, it is not necessarily positive for markets. Growing savings is a flipside of falling spendings. While demand is higher than the economic capacity, shrinking spending only leads to less inflation pressure. The problem is that if the spending contraction gains momentum, it may hit demand and economic output because of it. Figure 1 demonstrates that almost all US recessions were accompanied by a growing savings rate.
By far the US economy looks resilient. Even before the figures came out, the Fed’s GDP growth nowcasting stood at 1.8%. After the data was released, the GDP growth estimation was lifted to 2.2% (Figure 2).
Figure 2. Atlanta Fed GDP nowcasting
It should be noted that in Q3&Q4 2022 the US real GDP grew 3.2% and 2.6% respectively. Despite that the stock market was under huge pressure due to recession expectations. In a sense, the current economic state is secondary. Has an upcoming recession become less likely over the past half a year? We would not say so. It looks like the economy is getting less hot more slowly than many thought, but we can find very few arguments for the situation has changed in principle. With that said, we assume that the most powerful driver for the current market is the momentum it has gained, but not fundamental gauges.